Figures & data
Fig. 1. Purification and characterization of SW480 EVs and SW620 EVs. (a) Cells were incubated with media containing 10% FBS or serum-free media for 24 h. Serum-free medium did not induce apoptosis under our experimental conditions, as shown by an assay for cleaved PARP. As a positive control for apoptosis, cells were treated with 10 µM of staurosporine (STA) in serum-free media for 24 h Citation68. (b) Fractions of OptiPrep density gradients were analysed by Western blotting. CD63 and CD81, marker proteins of EVs Citation1, were detected in fraction 3. (c) The size distribution of EVs was measured by NTA indicating an average diameter of 159.1±11.1 nm (ranged from 23.0 to 636.3 nm) and 165.5±8.6 nm (ranged from 26.7 to 574.7 nm) for SW480 EVs and SW620 EVs, respectively. (d) Electron microscopy revealed that purified EVs were small closed vesicles lacking apoptotic bodies, cellular debris or protein aggregates. Scale bar = 200 nm.
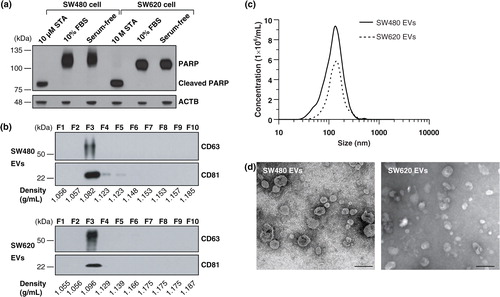
Fig. 2. Quantitative proteomic analysis of SW480 EVs and SW620 EVs. (a) Schematic workflow of the quantitative proteomics of EVs indicates the number of proteins in each step. (b) The Venn diagram shows the overlapped proteins in SW480 EVs and SW620 EVs. The GO analyses for cellular components (c) and biological processes (d) of SW480 EVs and SW620 EVs. Note that proteins normally have several GO annotations.
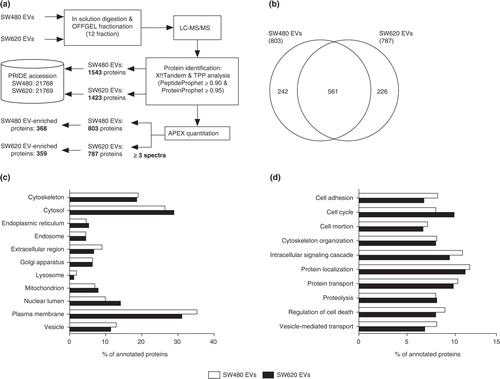
Fig. 3. Comparison of EV proteomes with secretomes and other CRC cell-derived EV proteomes. The number of identified proteins and GO cellular component annotation were compared between EVs and secretomes Citation11 derived from SW480 (a and b) and SW620 (c and d). Note that proteins normally have several GO annotations. p<10−5 is denoted by *. The Venn diagrams show the overlap of proteins identified by SW480 EVs and SW620 EVs with HT29 EVs and LIM1215 EVs (e) and CRC ascites-derived EVs (f).
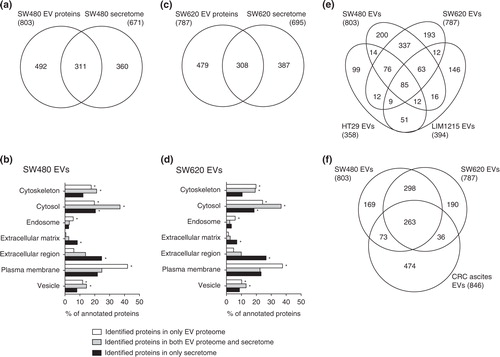
Fig. 4. Comparative proteomic analysis of SW480 EVs and SW620 EVs. (a) Using the APEX tool Citation13, the relative abundances of vesicular proteins were calculated and their abundances were given in arbitrary units. Black dots show the 302 common EV proteins with expression changes of less than 1.5-fold. Blue dots indicate the 368 SW480 EV-enriched proteins with more than a 1.5-fold upregulation in protein abundance compared to SW620 EVs or only identified in SW480 EVs. Red dots denote the 359 SW620 EV-enriched proteins with more than a 1.5-fold upregulation in protein abundance over SW480 EVs or only identified in SW620 EVs. (b) Predicted fold-changes based on quantitative proteomics were validated by Western blotting of whole cell lysates (50 µg) and EVs (2 µg). Results are representative of 2 experiments. (c) Proteomes of common EV proteins, SW480 EV-enriched proteins and SW620 EV-enriched proteins were analysed by GO biological process annotations. Note that proteins normally have several GO annotations.
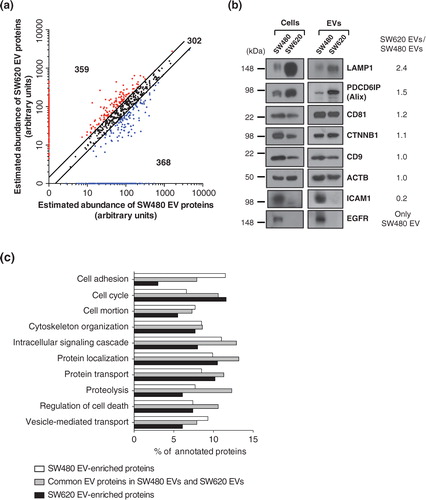
Table I. Cell adhesion-associated EV proteins enriched in SW480 EVs compared to SW620 EVs
Table II. CRC progression- and metastasis-related proteins enriched in SW620 EVs compared to SW480 EVs