Figures & data
Fig. 1. Sample preparation. All supernatants were freshly used for TEM, FCM and TGA.
PBS: Phosphate Buffer Saline. Sup: Supernatant. Filt: Filtrate. UC: ultracentrifugation.
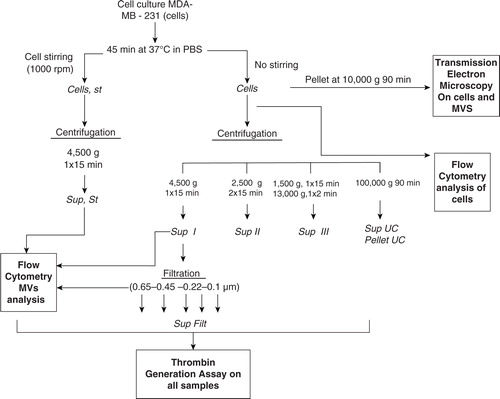
Fig. 2. Transmission electron microscopy pictures of cells with derived MVs (white arrows) after ultracentrifugation at 10,000 g during 90 minutes. A) Scale bar=2 µm. N: nucleus C: cytoplasm; B) scale bar=500 nm; C) scale bar=2 µm.
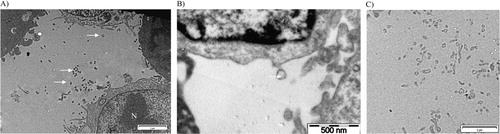
Fig. 3. Expression of TF (CD142) and MUC-1 (CD227) on MVs depleted of cells. A) Tumour microparticle analysis. Dual fluorescence analysis of MDA-MB-231 MVs stained with CD227 fluorescein isothiocyanate (FITC) (FL1) and CD142– phycoerythrin (PE) (FL2). CD142+ CD227+ MVs are represented as green dots, CD142+ CD227– MVs as red dots, CD227+ CD142− MVs as blue dots and background noise or other MVs as orange dots. Percentage and absolute number (/µl) of each subpopulation are indicated; B) backgating of CD142+ CD227+ MVs (green dots), CD142+ CD227– MVs (red dots) and CD227+ CD142– MVs (blue dots) on FSC log-SSC log cytogram; C) expression of TF (CD142) and MUC-1 (CD227) on PBS without MVs; D) FSC-SSC of control PBS without MVs labelled similarly with CD142 and CD227. E) FSC-SSC dot plot of 500 and 900 nm beads used to gate on MVs.
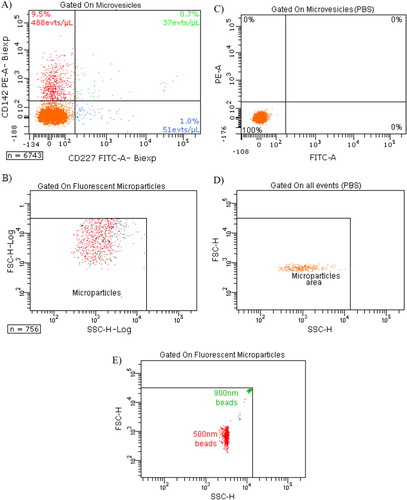
Table I. Flow cytometry concentration of MVs MUC-1+/TF−, MVs MUC-1-/TF+ and MVs MUC-1+/TF+ (/µl) in: cells and MPs (Cells), MDA-MB-231 supernatant (Sup), MDA-MB-231 supernatant produced with stirring (Sup, St), Sup filtered through 0.65 and 0.45 µm membranes (Sup Filt 0.65 µm and Sup Filt 0.45 µm) and PBS as control
Fig. 4. Curves of thrombin generation experiments and histograms of lagtime and peak parameters. In control condition, NPP is spiked with PBS. Curve data are presented as means of n=3. All the results are representative of 3 independent experiments. A) NPP spiked with MDA-MB-231 cells (Cells) or supernatant from MDA-MB-231 cells (Sup). The supernatant shows only slightly reduced PCA as compared to cell+supernatant; B) NPP spiked with supernatant from MDA-MB-231 cells (Sup), filtered or not through membranes with various sizes (Sup Filt 0.1 µm/0.22 µm/0.45 µm/0.65 µm). Filtration through 0.65 or 0.45 µm reduces only slightly the PCA, whereas filtration through 0.22 and 0.1 µm leads to stronger reduction in PCA; C) procoagulant effect of MVs (Sup) pre-incubated with or without HTF-1 (TF-blocking Ab), TF9-10H10 (TF-non-blocking Ab) or isotypic control antibodies at 10 µg/ml. HTF-1 strongly inhibits PCA of MV-containing supernatant; D) procoagulant effect of MVs (Sup) pre-incubated with or without annexin V at 0.5 µM. Annexin V abolishes the PCA activity of the MV-containing supernatant; E) procoagulant effect of MVs derived from 100,000 cells (Sup), of the pellet obtained after ultracentrifugation of MVs (pellet UC Sup) and of the supernatant obtained after ultracentrifugation of MVs (Sup UC).
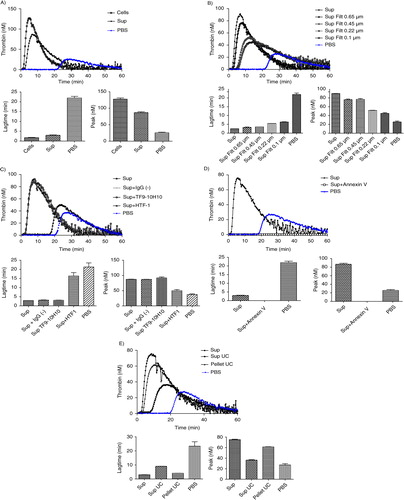
Fig. 5. Effect of stirring during cell incubation and of cell centrifugation protocol on thrombin generation. A) Thrombin generation curves and histograms of lagtime and peak parameters of normal pool plasma (PBS) spiked with MDA-MB-231 cells stirred (Cells, st) or not (Cells) or with their respective supernatant (Sup, st and Sup). No difference in PCA is observed between the stirred and non-stirred samples; B) Thrombin generation curves and histograms of lagtime and peak parameters of normal pool plasma spiked with supernatant of cells filtered or not (Sup vs. Sup Filt 0.1 µm) and produced by 3 different centrifugation protocols (Sup I, II, III). In control wells, NPP is spiked with PBS. The curve is representative of 3 independent experiments.
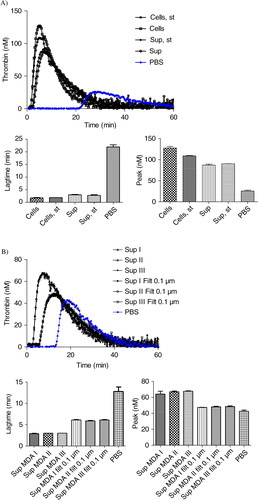
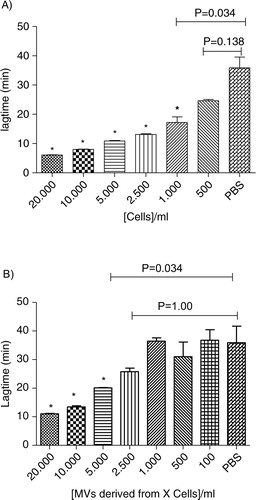
Fig. 6. Procoagulant effect of cells (Cells, A) and MVs (Sup, B) derived from different MDA-MB-231 cell concentrations (0; 100; 500; 1,000; 2,500; 5,000; 10,000; and 20,000 cells/ml) on lagtime. In control wells, NPP is spiked with PBS. Results are presented as mean±SD. Data with significant difference in comparison to control are indicated with *(p<0.05).