Figures & data
Fig. 1. Measuring beads or extracellular vesicles under flow conditions by nanoparticle tracking. (A) Standard 100 nm beads were diluted (1 in 1,000) in particle-free water, and measured six times using the NanoSight nanoparticle tracking system. Data from each repeat measurement is shown, revealing the overall size distribution (histograms) and mode (nm) and particle counts (p/ml). To evaluate reproducibility of the measurements, the counts (blue squares) and mode (red circles) for each measurement is shown. An average histogram was plotted from the data, and the mode and particle concentration is calculated (±SD). (B, C) As examples of biological vesicles, similar analyses using sucrose cushion isolated exosomes secreted from a mesothelioma cell line (B) or the prostate cancer cell line, LNCAP, (C) showing each measurement and the variation across the six measurements.
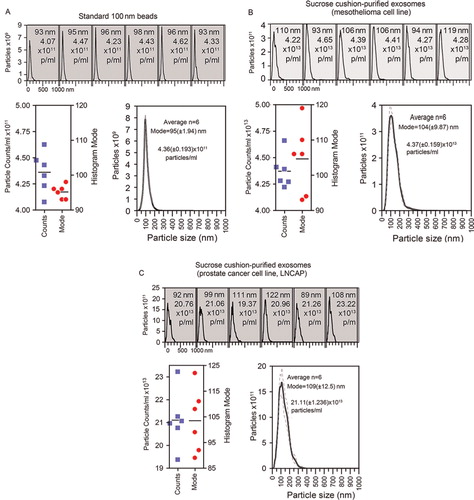
Fig. 2. Particle to protein ratio diminishes with contaminating protein. (A) Extracellular vesicles were purified from prostate cancer cell line (LNCAP) using the sucrose cushion method, and were intentionally contaminated with a solution of bovine serum albumin that was pre-filtered through a 20 nm filter, and confirmed particle free (not shown). The graph plots the protein concentration (µg/ml, left axis) and particle concentration (particles/ml, right axis) against the proportion of non-exosomal (contaminating) protein (% contamination). (B) The ratio of particles to protein for each sample is shown.
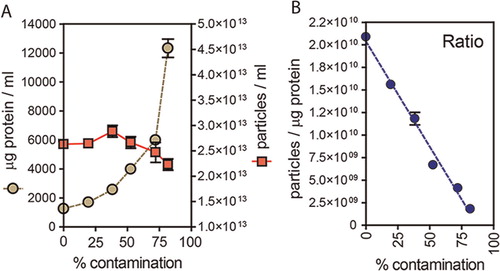
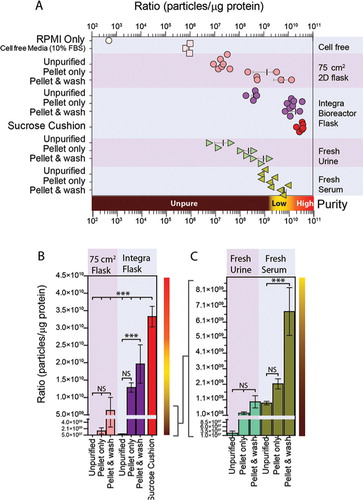
Fig. 3. Use of particle to protein ratio to quantify vesicle purity. (A) We compared the ratio of particles/protein across various sample types, and purification methods. This includes specimens from standard 2D plastic-adherent cultures including un-purified particles (MCF7 n=3, PC3 n=2, DU145 n=2) vs. simple pellet (MCF7 n=1, PC3 n=1, DU145 n=1) vs. pellet and wash (MCF7 n=1, PC3 n=1, DU145 n=1) methods. These are compared to un-purified particles (PC3 n=1, DU145 n=2, HT1376 n=1) vs. simple pellet (PC3 n=1, Du145 n=1, Ht1376 n=1, LNCAP n=1, #15 n=1) vs. pellet and wash (PC3 n=1, Du145 n=1, Ht1376 n=1, LNCAP n=1, #15 n=1) specimens obtained from Integra bioreactor culture systems, and biological specimens such as fresh serum (n=3) and urine samples (n=3). A sucrose cushion method was used with Integra bioreactor culture supernatants (PC3 n=1, Du145 n=2, Ht1376 n=1, LNCAP n=1, #15 n=1). The ratio measurement for RPMI and cell-free RPMI containing 10% FBS is also shown for comparison. (B/C) The same data are presented as linear plots, to better highlight the difference in ratio due to pellet and pellet and wash methods. From the collective data, ratios approaching 3×10¹⁰ are highlighted as high purity, with those <108 are arbitrarily considered unpure.