Figures & data
Fig. 1. Surface-exposed Chlamydia HtrA does not elicit neutralizing antibodies. (A) HtrA Chlamydia HtrA is expressed on the EB surface. Purified CM (left panel) and CT (right panel) EBs were incubated with sera raised against CM rHtrA or CT rHtrA (empty peaks) or anti-E. coli contaminants (shaded peaks) and the antibody binding on EB surface was detected by flow cytometry using a R-Phycoerythrin-conjugated secondary antibody. Inset panels: Western blot analysis of HtrA expressed by EBs. Total extracts from CM or CT EBs (approximately 107) and purified CM or CT rHtrA were separated on SDS-PAGE, transferred to nitrocellulose membranes and incubated with the corresponding rHtrA antiserum. Molecular weight standards are reported on the left side of each panel. (B) Antibodies elicited by CM rHtrA do not neutralize Chlamydia infectivity in vitro. Anti-CM rHtrA and anti-CT rHtrA antibodies were pre-incubated at different dilutions with infectious CM EBs (left panel) and CT EBs (right panel), respectively, and used to infect LLC-MK2 cell monolayers, as compared with EBs treated with corresponding dilutions of pre-immune sera. As positive controls, anti-CM rMOMP and anti-CT rMOMP were also used simultaneously. The antiserum neutralization activity was determined by measuring the reduction of the number of inclusions generated by antibody-opsonized EBs after correction for background inhibition observed with pre-immune sera. The graphs represent the percent neutralization averaged from triplicate experiments, with standard deviations.
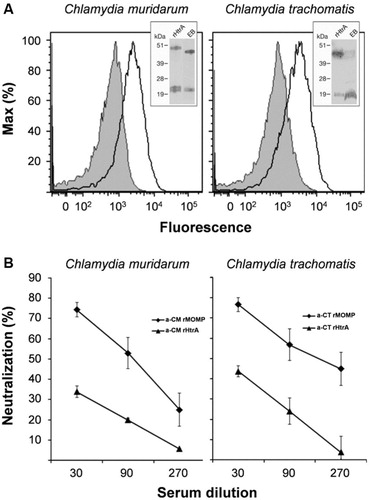
Fig. 2. CM rHtrA expressed by E. coli BL21(DE3) ΔtolR(pET-htrA) is associated with the OMV fraction and is partially detected on the OMV surface. (A) Western blot analysis of CM rHtrA expression and compartmentalisation. Mid log cultures of E. coli BL21(DE3) ΔtolR(pET-htrA) (marked as ΔtolR(pET-htrA)) were induced with 1 mM IPTG for 3 h. CM rHtrA expression was assessed by Western blot in total bacterial extracts (TE), culture supernatant before (S1) and after (S2) OMV purification and in the purified OMV fraction. Each loaded sample corresponded to 5 mL of the original bacterial culture. OMVs purified from the recipient strain E. coli BL21(DE3) ΔtolR(pET) (empty OMV) and IMAC-purified CM rHtrA were run simultaneously as controls. As shown in the figure, CM rHtrA exists in 2 major protein species of approximately 48 and 20 kDa, representing the full length and a processed form of the protein, as verified by MALDI-TOF analysis. Both bands are also visible in the ΔtolR(pET-htrA)-derived samples. CM rHtrA bands show a slightly higher molecular weight due to the presence of the histidine tag. Molecular weight markers are on the left. (B) Estimation of CM rHtrA amount present in CM rHtrA-OMVs by comparative Western blot. Different quantities of CM rHtrA-OMVs and CM rHtrA were analyzed by immunoblot and the amount of rHtrA present on CM rHtrA-OMVs was estimated by densitometric analysis of the 48-kDa HtrA band (boxed). (C) FACS analysis of rHtrA surface exposure on CM rHtrA-OMV. Purified CM rHtrA-OMV (empty peak) and “empty” OMVs (shaded peak) were incubated with anti-CM rHtrA antibodies. CM rHtrA-OMV were also incubated with antibodies raised against E. coli contaminants (dotted peak) as an additional negative control. The binding was revealed using an Alexa Fluor 647 labelled secondary antibody. (D) Immuno electron microscopy analysis of CM rHtrA-OMV. CM rHtrA-OMVs and empty OMVs were incubated with anti-CM rHtrA antibodies and the presence of rHtrA was detected with a secondary gold-conjugated antibody. Arrows indicate HtrA immunogold staining. Bars represent the image size scale.
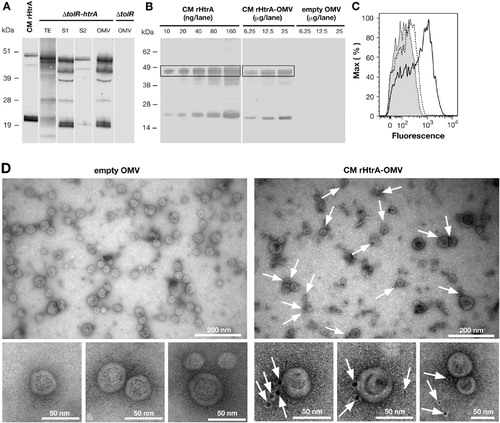
Fig. 3. Antibodies raised against rHtrA-OMV recognize C. muridarum HtrA and bind the EB surface. (A) HtrA-specific ELISA IgG titres. Sera from mice immunized with different OMV formulations (CM rHtrA-OMV, empty OMV and empty OMV mixed with rHtrA) and with purified rHtrA (doses of 20 and 1 µg) were collected 2 weeks after the third immunization and IgG titres were analyzed by ELISA. Bars represent the mean titres of each mouse group expressed as the reciprocal of the serum dilution yielding an OD value of 0.5. (B) Western blot analysis of CM EBs. Total extracts of CM EBs and purified CM rHtrA were loaded on the gel, transferred to nitrocellulose and immunoblots were probed using antibodies raised against CM rHtrA-OMV (left panel) and empty OMV (right panel). Molecular weight standards are reported on the left of each panel. (C) Flow cytometry analysis of CM EBs. CM EBs were incubated with anti-CM rHtrA-OMV (open peak) and anti-empty OMV antibodies (shaded peak) and surface-bound antibodies were detected by flow cytometer using a R-phycoerythrin-conjugated secondary antibody.
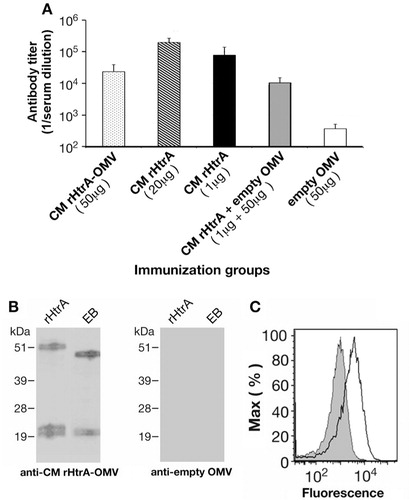
Fig. 4. Antibodies directed against CM rHtrA-OMV neutralize Chlamydia infectivity in vitro. CM EBs (left panel) and CT EBs (right panel) were opsonized with sera directed against CM rHtrA, CM rHtrA-OMV, “empty” OMV at different dilutions and used to infect LLC-MK2 cell monolayers, in comparison with EBs treated with corresponding dilutions of pre-immune sera. As controls, EBs were also incubated with anti-CM rMOMP and anti-CT rMOMP antibodies. The antiserum neutralization activity was determined by measuring the reduction of the number of inclusions generated by antibody-opsonized EBs after correction for background inhibition observed with pre-immune sera. The graphs present the percent neutralization averaged from triplicate experiments, with standard deviations.
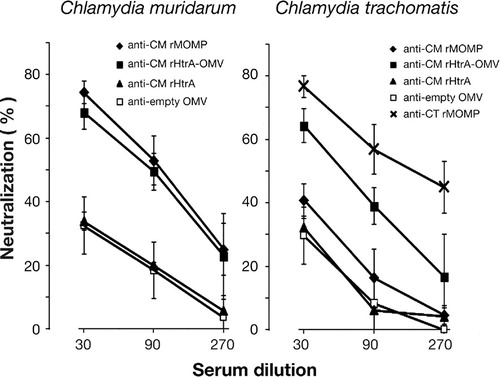
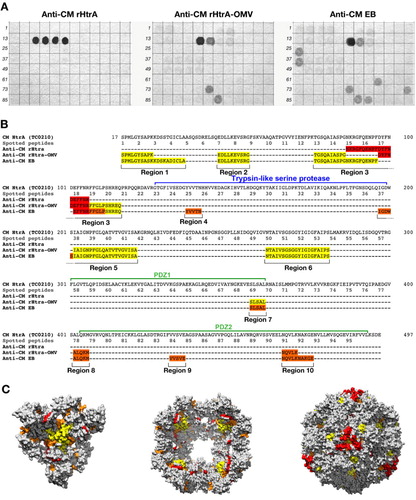
Fig. 5. Differential epitope recognition pattern of CM rHtrA and CM rHtrA-OMV antisera. (A) Peptide arrays (96 peptides) were prepared on a cellulose membrane by in situ synthesis of overlapping sequences of 15-residue peptides covering the amino acid sequence of the mature CM HtrA form and tested for binding by immunoblotting with polyclonal antibodies directed against CM rHtrA-OMV (left), CM rHtrA-OMV (centre) and CM EBs (right). Membranes incubated with serum raised against empty OMVs and run simultaneously gave negative staining. Numbers on the left of each blot mark the first peptide of each row of the arrays. (B) Colour code representation of the amino acid regions recognized by the different antisera on the mature from of the CM HtrA protein sequence. The sequences recognized by each antiserum are highlighted according to the staining intensity of spotted peptides: red, high intensity; orange, moderate intensity; yellow, low intensity. (C) Molecular modelling of CM HtrA multimeric forms. The 3-mer basic structure that assembles in multiple copies to form both the bowl-shaped, lipid-associated structures and the spherical soluble structures is shown on the left. The 4-fold symmetry bowl-like structure proposed by Shen and colleagues (Citation29) is reported in the central panel of looking at the solvent-exposed concave face of the structure. Finally, the spherical structure of 24-mer soluble HtrA is reported in the right-hand side of the figure. The regions recognized by anti-CM rHtrA and anti-CM rHtrA-OMV antibodies are highlighted in the 3 models maintaining the same colour code as in (B). The models were generated from PDB structure 3cs0.