Figures & data
Fig. 1 (A) Extracellular vesicle detection using a customized protein microarray “EV Array”. A microarray print with spots of 21 different antibodies is used to capture exosomes from, for example, plasma or cell culture supernatants. The captured vesicles (exosomes) are detected with a cocktail of biotinylated antibodies against the tetraspanins CD9, CD63 and CD81 followed by fluorescence-labelled streptavidin. (B) The technology of using protein microarray for exosome detection was validated using NTA and a series of experiments with different exosome sources and microarray print setups as illustrated in the flowchart. Microarray print with a cocktail of the capturing antibodies CD9, CD63 and CD81 was used to detect the signals from all exosomes present in the samples in a semi-quantitative manner in order to obtain the limit of detection (LOD, ). This setup was also used to capture exosomes prior to elution (supplemental material) and validation by NTA. Microarray prints with a panel of 21 different capturing antibodies was used to phenotype the exosomes (positive for CD9, CD63 and/or CD81) present in plasma from 7 healthy individuals ().
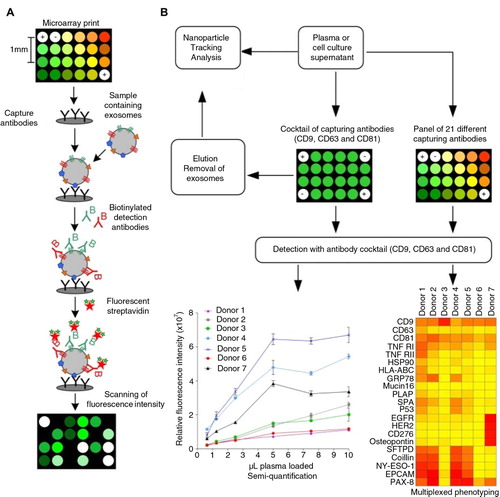
Fig. 2 (A) Nanoparticle Tracking Analysis of the starting material from the EV Array analysis compared to the eluted particles after capturing on a microarray printed with a cocktail of antibodies against CD9, CD63 and CD81. The analyses were performed on a plasma sample (Donor N) and on cell media containing exosomes from the cancer cell lines SW948 (colon) and OAW42 (ovarian). No signals were obtained above 500 nm. The mode and mean values for each sample are given. (B) EV Array detection of exosomes captured on slides printed with a cocktail of antibodies against CD9, CD63 and CD81. The fluorescence intensities (mean±SD) are shown in relation to the number of LS180 (colon cancer) cells producing the exosomes within 48 h. A linear correlation (R 2>99%) is seen and the red line indicates 2 SD of the negative control demonstrating a limit of detection (LOD).
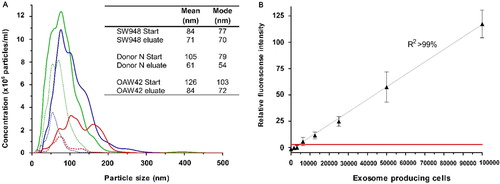
Fig. 3 Microvesicle analysis of plasma from 7 healthy donors. (A) A series of dilutions were tested in triplicates on EV Array slides printed with a cocktail of capturing antibodies (against CD9, CD63 and CD81). The relative fluorescence intensities of the spots (mean±SD) are plotted against the volume of plasma added. (B) Nanoparticle Tracking Analysis of the plasma revealed a great variance of the microvesicle distribution and particle concentration. Donors 4 and 5 are observed to have a higher number of vesicles <100 nm (exosomes) as indicated by the grey line.
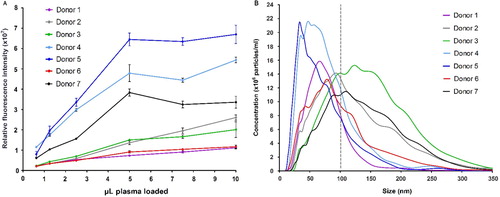
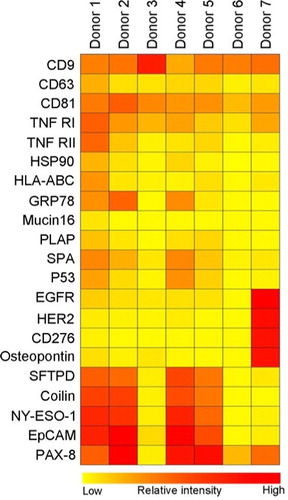
Fig. 4 Summary of the phenotyping of the exosomal (positive for CD9, CD63 and/or CD81) population in plasma from 7 healthy donors. The exosomes were profiled using an EV Array printed with 21 different capturing antibodies. The relative fluorescence intensity was log2 transformed and a hierarchical clustering was performed to illustrate the phenotypes of the plasma-derived exosomes.