Figures & data
Fig. 1. (A) Scanning electron microscopic (FEI Quanta 250 FEG SEM) pictures of MVs produced by serum deprivation at magnification of 60,000× (i) and 90,000× (ii). Negative stainings (FEI Tecnai 12 TEM) of the same sample at magnification of 30,000×(iii). (B) Scanning electron microscopic pictures of MVs produced by IFN-γ stimulation at magnification of 60,000× (i) and 90,000× (ii). (C) Representative nanoparticle tracking analysis (NTA) profiles of MVctrl and MVstim. (D) Size distribution of MV ctrl and MVstim measured by NTA. Results are mean±SEM of 3 independent experiments. (E) The effect of MVs or hUCBMSCs on Treg induction after 7 days of MV or MSC cultured with allogeneic PBMCs. Representative flowcytometric analysis of CD25+-FOXP3+ Tregs are shown for CD4+ gated T lymphocytes. (F) The effect of MV and MSCs on T-cell proliferation analyzed by CFSE labelling of PBMCs and activation of T-cells with monoclonal CD3 antibody.
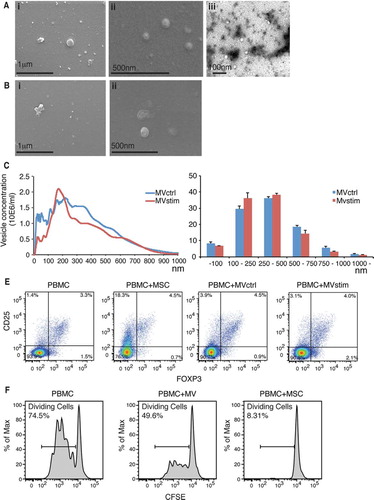
Fig. 2. Proteome analysis of hUCBMSC MVs. (A) The Venn diagram illustrates common and unique proteins in control MVs (MVctrl) and stimulated (MVstim). (B) The subcellular locations of protein found in either MVctrl (white bar) or MVstim (grey bar) according to UniprotKB database.
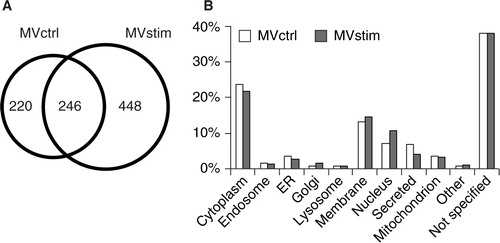
Fig. 3. Functional enrichment analysis of MV proteome. (A) Major enriched gene ontology biological processes (GO-PB) terms of 220 proteins identified only in MVctrl. (B) Major enriched GO-PBs of 448 proteins identified only from MVstim. (C) Major GO molecular functions enriched in MVctrl or MVstim. Similar GO terms were excluded for clarity.
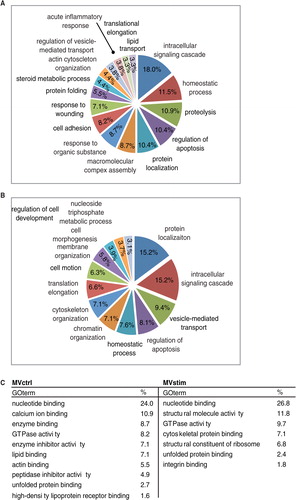
Fig. 4. Detailed analysis of MV proteomes revealed remarkable differences in protein compositions of MVctrl and MVstim. Proteins involved in vesicular transport, immunological response and regulation of apoptosis were selected for illustration. (A) Proteins identified by mass spectrometry only from MVctrl. (B) Proteins identified by mass-spectrometry (MS) only from MVstim. (C) The number of identified proteins included in selected protein families found in MVctrl or MVstim. The number of unique proteins is shown in parenthesis. See Supplementary file for complete lists of identified proteins.
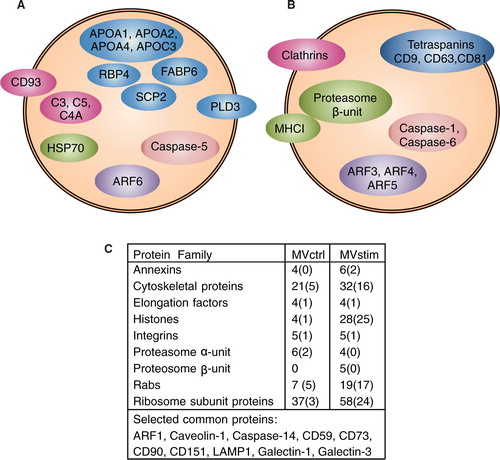
Fig. 5. The effects of MV treatment on serum creatinine, urea and liver enzymes in rats with renal ischemia-reperfusion injury measured 24 and 48 hours post-operation. (A) Serum creatinine concentrations (µmol/L). (B) Serum urea concentrations (mmol/L). (C) serum aspartate aminotransferase (ASAT) activity (U/L). (D) Serum gamma glutamyltransferase (γ-GT) activity (U/L). RIR denotes rats with renal I/R injury. RIR+PBS, rats with I/R injury treated with PBS after reperfusion (solid squares); RIR+MVctrl, rats with I/R injury treated with control microvesicles (open circles); RIR+MVstim, rats with I/R injury treated with interferon-γ microvesicles (solid circles). Mean±SEM are given, n=5–8 in each group. *p<0.05 RIR+MVctrl vs. RIR; #p<0.05 RIR+MVctrl vs. RIR+MVstim.
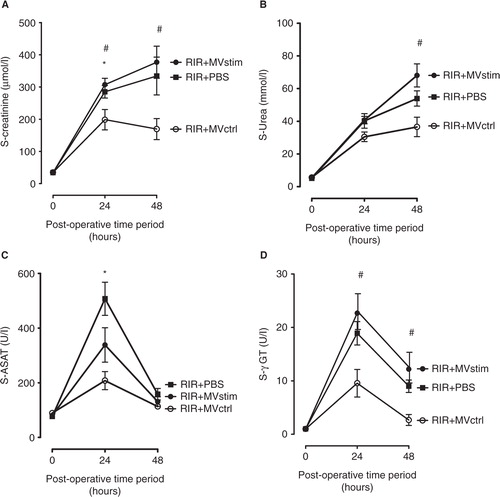
Fig. 6. Effects of MV treatment on acute tubular necrosis (ATN) in rats with renal ischemia-reperfusion injury. (A) Representative photomicrographs from untreated rats with I/R injury. (B) Representative photomicrographs from rats with I/R injury treated with MVctrl. (C) Representative photomicrographs from rats with I/R injury treated with MVstim. Magnification ×200, scale bar 100 µm. (D) Quantification of ATN with a scoring system. RIR denotes rats with renal I/R injury; RIR+MVctrl, rats with I/R injury treated with control microvesicles after reperfusion; RIR+MVstim, rats with I/R injury treated with interferon-γ microvesicles after reperfusion; *p<0.05 RIR+MVctrl vs. RIR; #p<0.05 RIR+MVctrl vs. RIR+MVstim.
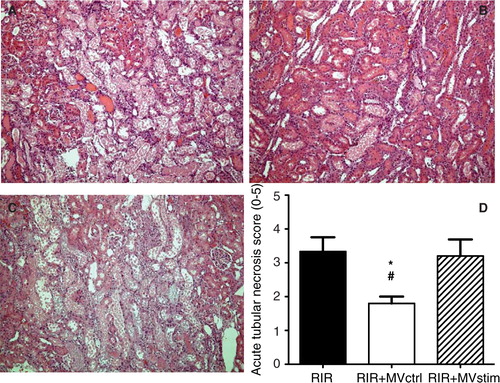
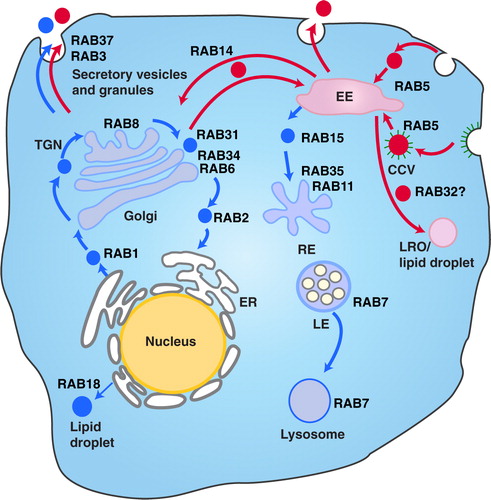
Fig. 7. The different vesicle transport pathways and the functions of Rab GTPases identified from the hUCBMSC MVs. Rab proteins found in MVstim were related to deeper endosomal route (blue), whereas MVcrtl contained Rab proteins from the rapid loop located near the plasma membrane (red). RAB1, which is localized at the endoplasmic reticulum (ER), mediates ER–Golgi trafficking together with RAB2, which might also regulate Golgi–ER trafficking. The Golgi-localized RAB6 and RAB34 mediate intra-Golgi trafficking. RAB8 mediates constitutive biosynthetic trafficking from the trans-Golgi network (TGN) to the plasma membrane. RAB3, and RAB37 regulate the secretory pathway. RAB32 is involved in the biogenesis of melanosomes and other lysosome-related organelles (LRO) as well as the formation of lipid droplets from the early endosome (EE). RAB18 controls the formation of lipid droplets from the ER. RAB5 mediates endocytosis and endosome fusion of clathrin-coated vesicles (CCVs). RAB11 and RAB35 mediate slow endocytic recycling through recycling endosomes, (RE). RAB15 is involved in the trafficking from early endosomes (EE) to recycling endosomes. The late endosome-associated RAB7 mediates the maturation of late endosomes (LE) and their fusion with lysosomes. See Refs. (Citation75, Citation79) (Citation80, Citation81) for further information.