Figures & data
Fig. 1. (A) Study workflow diagram. This diagram gives an overview of the experimental steps performed in this study. (B) Scatter plot of comparison of expression levels of identified proteins in LNCaP and PC3 exosomes. (C) String analysis of proteins present (>50 times detected) in both LNCaP and PC3 exosomes. (D) String analysis of proteins that were abundant at significantly (p<0.05) higher levels PC3 exosomes compared to LNCaP exosomes. All proteins were abundantly expressed in the exosomes of both cell lines. In this analysis, a cluster of proteins (encircled) was involved in migration and invasion (David functional analysis). (E) String analysis of proteins that were abundant at significantly (p<0.05) higher levels PC3 secretome compared to LNCaP secrectome. Secretome data were obtained from Sardana et al., 2008 (Citation15).
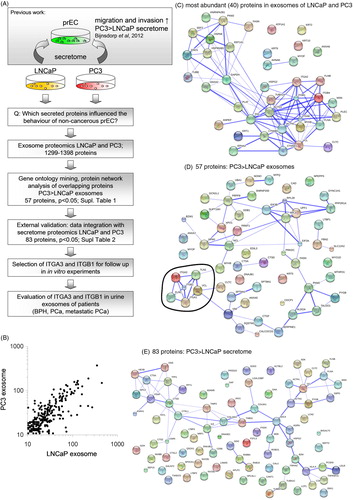
Table I. Protein composition of exosomes of LNCaP and PC3 cells involved in focal adhesion and cytoskeletal regulation
Fig. 2. (A) Western blot showing the expression of ITGB1, ITGA3 and PDCD6IP in exosomes and whole cell lysates of LNCaP and PC3 cells. (B) Effect of blocking antibodies of ITGA3 and ITGB1, which were added combined with LNCaP-medium (CM-L) or PC3-medium (CM-P) on the migration and invasion of prEC. As negative controls, isotype control was added. Statisticial differences between controls and between antibody and CM-L or CM-P are indicated in the graph (*p<0.05) (C) Exosomal uptake of LNCaP and PC3 exosomes in prEC cells as measured by FACS analysis. Values represent means of 3 independent experiments. (D) Effect of exosomes from LNCaP and CP3 cells on prEC invasion, with/without blocking antibodies against ITGA3 and ITGB1. As antibody-controls, isotype control was added. Statisticial differences are indicated in the graph (*p<0.05).
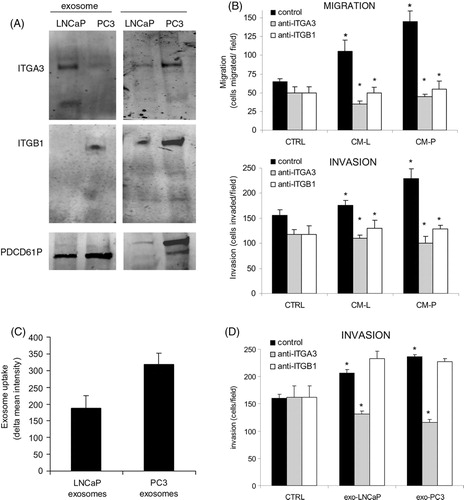
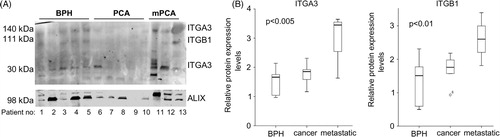
Fig. 3. (A) Western blot showing the expression of ITGA3, ITGB1 and PDCD6IP in urine-exosomes of patients suffering from BPH, prostate cancer (PCA) and metastatic prostate cancer (mPCA). (B) Quantitative analysis showing the boxplots of the expression of ITGA3 (30kDa variant) and ITGB1, relative to PDCD6IP.