Figures & data
Fig. 1. Setting up the dedicated flow cytometer (FC). (a) The resolution of the reference bead mix indicates the FC's performance in light scattering at default settings. Left cytogram shows small angle light scatter (SALS) versus large angle light scatter (LALS). Right cytogram depicts SALS versus 535/35 (green fluorescence triggering) channel. Six populations with refractive index (RI) 1.42 (blue ellipses) and two green fluorescent populations (110 nm and 500 nm) with RI 1.59 (red ellipses) were resolved from the instrument noise (black ellipse). The original outputs from Histogram software (Apogee Flow Systems) are shown. (b) Use of filtered (0.22 PVDF filter) PBS is highly recommended for all FC measurements. Left panels, diagrams show SALS versus LALS cytograms, middle panels show SALS versus 535/35 for ungated population, while right panels represent cytograms events gated on ROI 1 (beads) of reference bead mix in the SALS versus LALS cytograms. Gating on ROI 1 eliminates very rare false positive events in upper left quadrant B in case of PBS, but also results in significant decrease of fluorescently positive exs detected in this quadrant and thus is not used in following experiments. On contrary, employing the filtered PBS significantly decreased the total number of presumably noise events recorded in quadrant D, as well as non-specific events in quadrant B.
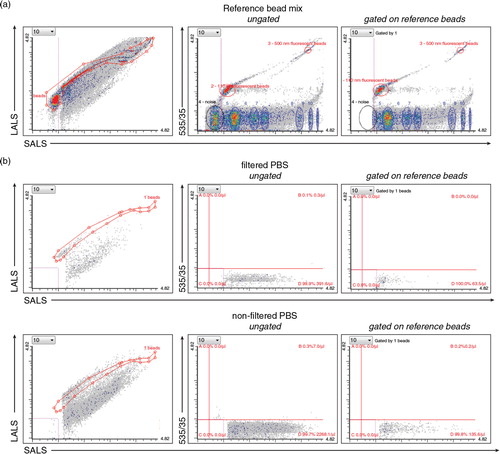
Fig. 2. Isolation of microvesicles (MVs) and exosomes (exs) by ultracentrifugation (UC) and sucrose cushion. A schematic representation of protocol used to isolate extracellular vesicles (EVs). Black boxes describe the purpose of each centrifugation step, blue boxes contain additional instructions/explanation. Optional filtration step is indicated by italics. Green boxes depict fraction after centrifugation at relative centrifugation force (RCF) indicated by number (in thousands×g). P, pellet; S, supernatant.
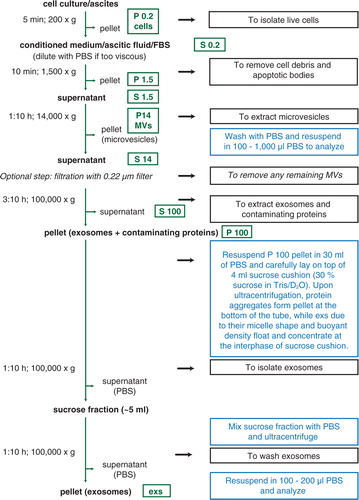
Fig. 3. FC analysis of EVs isolated from cell culture media. (a) EVs were labeled by protein-specific (CFSE) fluorescent dye either during their genesis in cells (HEK293 exs+CFSE in conditioned media(CM)) – middle panel, or just prior to measurements (HEK293 exs+CFSE) – lower panel. The upper panel consists of negative control samples – CFSE-only, HEK293 exs-only, HEK293 MVs-only. (b) EVs were labeled by lipid-specific (FM 1-43FX) dye prior to measurements (HEK293 exs or MVs+FM 1-43FX). FM 1-43FXonly represents negative control sample. (a–b) SALS versus CFSE or FM 1-43FX (both green fluorescence) cytograms of ungated populations are plotted. The ROI statistics corresponds to fluorescent EVs. Note the difference between the appearance of exs population from the same source (HEK 293 cells) stained with different dyes and/or prior or after isolation. (c) Histograms of SALS of EVs from (a). Left, histogram of EVs labeled during cell culture. Middle, histogram of differentially labeled MVs isolated from HEK293 cells. Right, histogram of differentially labeled exs isolated from HEK293 cells. F; S14 filtered through 0.22 µm filter; NF, S14 non-filtered.
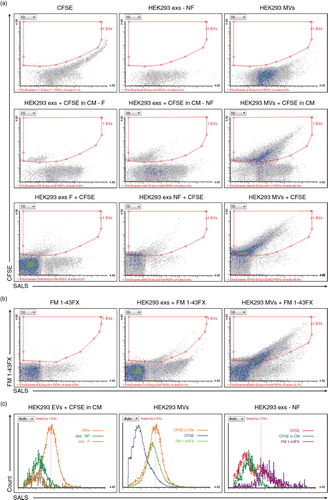
Fig. 4. Quantification of EVs by dedicated flow cytometer (FC). (a) Representative images of negatively contrasted exs and MVs from HEK293 cells (used in ) visualized by TEM. The morphological characteristics are unchanged for EVs derived from HEK293 cells in the presence of 2 µM CFSE in the CM. (b) Exs isolated from malignant ascites of ovarian cancer patients labeled by CFSE (upper middle and right panel), FM 1-43FX dye (lower left panel) and unlabeled (upper left panel). Note the difference between filtered (-F) and non-filtered (-NF) exs preparation. (c) Representative images of negatively contrasted exs from (b) visualized by TEM. Exs preparations isolated from malignant ascites of ovarian cancer patient #1 are contaminated by lipoprotein particles (smaller than exs, black asterisks) and sporadic MVs (larger than exs, black arrows), the latter are detected by FC also in (b). (d) Serial 2-fold dilutions of reference bead mix were measured using fluorescence threshold triggering. The measured values in ROI 2 (a) corresponding to 110-nm particles, (roughly reflecting exs) are plotted as red circles along with the calculated input amount of beads (X). Linear regression of log transformed data reveals slope −0.9954±0.0106, R2–0.9952. One representative experiment out of 3 is shown. (e) Quantification of exs from CM and patient samples. Left panel, event/µl for 10-fold dilutions of exs stained with CFSE in CM (indicated by squares), exs stained with CFSE prior to FC measurement (triangles) and exs stained with FM 1-43FX prior to FC measurement (spheres) were plotted against the dilutions. Slope/Y-intercept of linear regression analysis was calculated. Pooled slopes are presented for each source of exs indicated by color. Right panel, 10-fold dilutions of control samples (negative) indicate the background level of event/µl detected by FC.
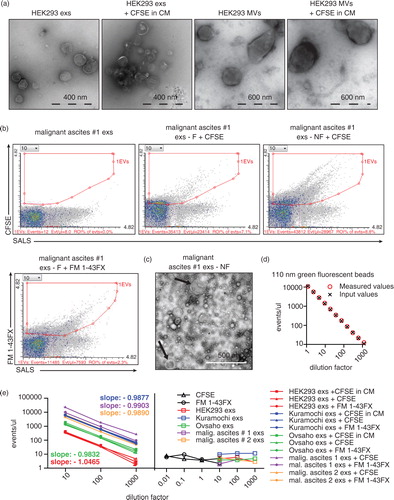
Fig. 5. Double labeling with protein– and lipid-specific dyes ensures precise enumeration of EVs. (a) MVs from HEK293 cells were pre-labeled during their biogenesis by CFSE in CM and post-labeled by FM 4-64FX dye. Upper cytograms show “CFSE+ gating first” strategy, lower diagrams show “FM 4-64FX+ gating first” strategy. The total amount of double positive MVs is the same in both strategies and equals the amount of EVs by direct gating for double positive MVs (right cytogram). (b) Exs from ascites of patient #1 were post-labeled by CFSE and FM 4-64FX dyes. Upper cytograms show “CFSE+ gating first” strategy, whereas lower diagrams show “FM 4-64FX+ gating first” strategy. The total amount of double positive MVs is the same in both strategies and equals the amount of EVs by direct gating for double positive MVs (right cytogram). – NF, 0.22 µm non-filtered.
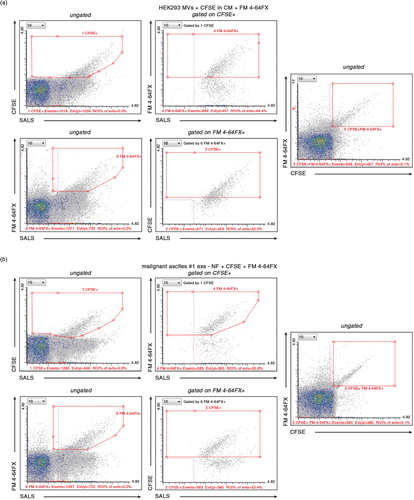
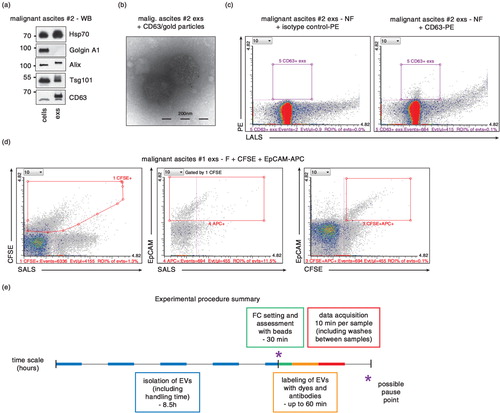
Fig. 6. Characterization of exs derived from ascites using antibodies. (a) Presence of characteristic exs markers Alix, Hsp70 and Tsg101 as well as CD63, and absence of “antimarker” Golgin A1 (present in the cells of origin but absent from exs) was verified by western blotting (WB) in cells (P 0.2 fraction) and exs from ovarian cancer patient #2. (b) TEM of exs isolated from ascites of ovarian cancer patient #2. Exs marker CD63 is detected at the surface of exs by secondary antibodies conjugated to 10-nm gold particles. (c) CD63+, exs derived from ascites of ovarian cancer patient #2 can be detected by FC analysis of CD63-PE antibody-stained exs (right panel). Left panel, exs stained with isotype control antibody-PE. (d) Double labeling of exs from ascites of patient #1 by CFSE and EpCAM-APC antibody reveals feasibility of double labeling and demonstrates that only 11.5% of CFSE+ exs are EpCAM+. (e) Summary of timing of the presented protocol. Each step is marked in the time scale by different color. For collection of EVs from conditioned media, cells are plated a day ahead. Isolation of exs can be achieved in 1 day. Setting up the instrument and FC data acquisition can be completed within the morning of the second day. – F, 0.22 µm filtered; – NF, 0.22 µm non-filtered.