Figures & data
Fig. 1. Separation of LDEV+ and LDEV− bone marrow cells cultured with CFSE-labelled LDEV. (a) Whole bone marrow (WBM) cells (5.3×10⁴ cells/cm2) cultured without CFSE-labelled LDEV for 48 hours. (b) Lin-/Sca-1+, (c) CD19+, (d) Ter119+ and (e) Gr-1+ cells (all 5.3×10⁴ cells/cm2) cultured with CFSE-labelled LDEV (one mouse lung equivalent) for 48 hours. LDEV+ cells (R3) and LDEV− (**) could be detected and separated by flow cytometry. Y-axis, CFSE (FITC); X-axis, forward scatter (FSC).
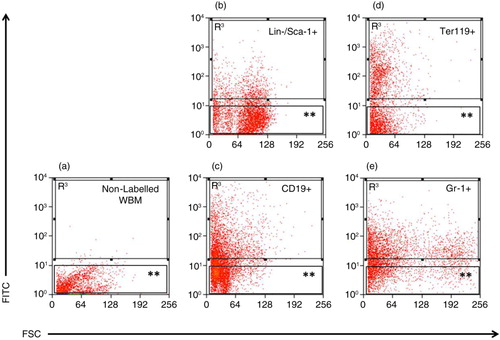
Fig. 2. Flow cytometry–separated LDEV+ cells. (a) Lin-/Sca-1+, (b) CD19+, (c) Ter119+ and (d) Gr-1+ cells that have internalized CFSE-labelled LDEV. CFSE-labelled LDEV (FITC, green) can be found adjacent to the nucleus (DAPI, blue). Red bar=10 µm.
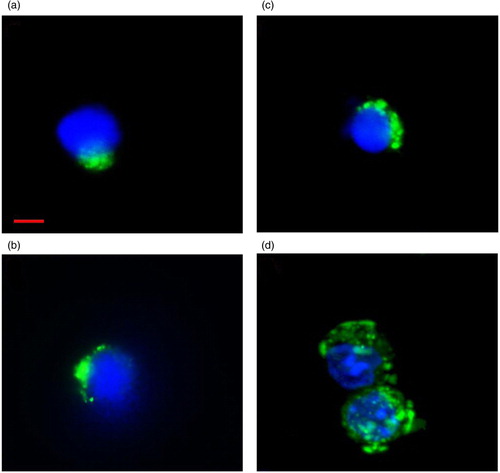
Table I. LDEV+ bone marrow cell populations after culture with CFSE-labelled LDEV
Fig. 3. Pulmonary epithelial cell mRNA transcripts detected in cells cultured with CFSE-labelled LDEV. (a) Cells cultured with CFSE-labelled LDEV (5.3×10⁴ cells/cm2 with one mouse lung equivalent of LDEV for 48 hours) that are LDEV+ and (b) LDEV−. Gene expression is relative to cells not exposed to LDEV in culture (control) and is displayed as heat maps using a base 2 logarithmic scale. Cell culture experiments performed 3 times, and fold expression values are an average of all 3 experiments. *p>0.05 (Student's t-test), gene expression versus control cells.
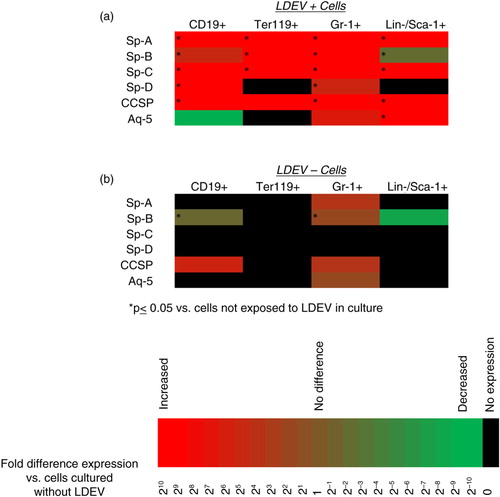
Fig. 4. Gene expression profile of LDEV+ Gr-1+ and Lin-/Sca-1+ cells in long-term culture. Expression of pulmonary epithelial cell genes, stem/progenitor cell genes and granulocyte genes in (a) Gr-1+ cells and (b) Lin-/Sca-1+ cells that are LDEV+ relative to cells that are LDEV−. Cells were cultured for 2, 4, 6 or 8 weeks (5.3×10⁴ cells/cm2). Gene expression changes relative to LDEV− cells are displayed as heat maps using a base 2 logarithmic scale. Cell culture experiments performed 3 times, and fold expression values are an average of all 3 experiments. *p > 0.05 (Student's t-test), gene expression versus control cells.
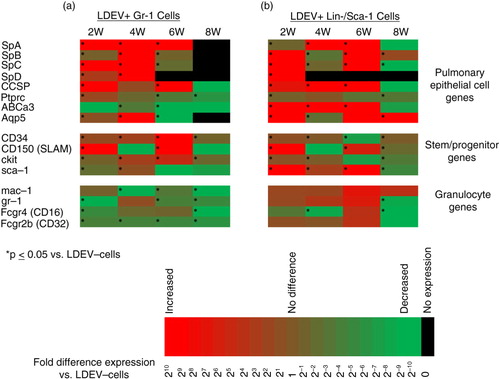
Fig. 5. Sp-B and Sp-C expression in the mouse Lin-/Sca-1 cell/rat LDEV hybrid co-culture, short term. Expression (+ + +) or no expression (–) of mouse- or rat-specific Sp-B, Sp-C in mouse Lin-/Sca-1+ cells that were cultured for 48 hours with CFSE-labelled rat LDEV (5.3×10⁴ cells/cm2 with 25 µg of rat LDEV). Shown is the presence or absence of expression in cells immediately after flow cytometry separation into LDEV+ cells and LDEV− cells (Day 0) and after 7 days of culture (Day 7).
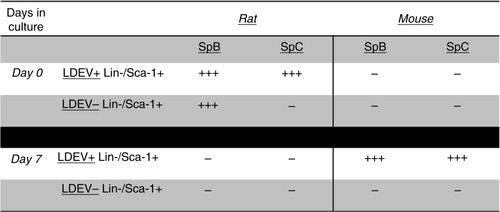
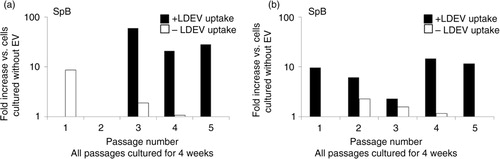
Fig. 6. Sp-B and Sp-C expression in the mouse Lin-/Sca-1 cell/rat LDEV hybrid co-culture, long term. Mouse-specific (a) Sp-B and (b) Sp-C expression in LDEV+ (black bars) and LDEV− (white bars) cells from each passage (X-axis) after 4 weeks of culture. No rat-specific Sp-B or Sp-C expression was found in either cell population (not shown). Fold difference of gene expression is compared to cells cultured without LDEV (Y-axis).