Figures & data
Fig. 1. Collection of gLuc-LA labelled exosomes. (a) Western blotting analysis of exosomes. Alix and Hsp70, exosome marker proteins, were detected by using Alix- and Hsp70-specific antibodies, respectively. Lane 1: gLuc-LA-labelled B16BL6 exosomes. Lane 2: B16BL6 exosomes. (b) Detection of gLuc on the surface of exosomes collected from B16BL6 cells transfected with gLuc-LA-expressing plasmid DNA. gLuc-LA-labelled B16BL6 exosomes were stained with protein A-gold nanoparticles after reaction with anti-gLuc antibody. The samples were observed by transmission electron microscopy. White arrows indicate gold nanoparticles. Scale bar = 100 nm.
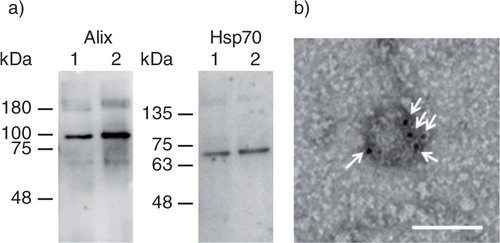
Fig. 2. Stability of exosome labelling by gLuc-LA in serum. (a) Time-course of stability of gLuc activity of gLuc-LA-labelled B16BL6 exosomes at 37°C in 20% FBS/PBS buffer. The initial gLuc activity was about 106 RLU/s/10 µL. (b) Time-course of exosome labelling stability of gLuc-LA at 37°C in 20% FBS/PBS buffer of 4 samples.
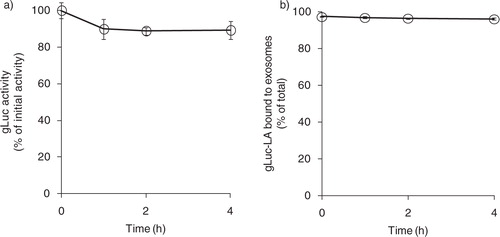
Fig. 3. Cellular uptake of B16BL6 exosomes labelled with PKH26. (a–c) Cryostat sections of the liver (a), spleen (b) and lung (c) collected from mice receiving PKH26-labelled B16BL6 exosomes (red) were stained with F4/80-specific antibodies (green). Scale bar = 100 µm. (d) Cryostat section of the lung stained with endothelial cell-specific lectin (green) collected from mice receiving intravenous injection of PKH26-labelled B16BL6 exosomes (red). Scale bar = 20 µm.
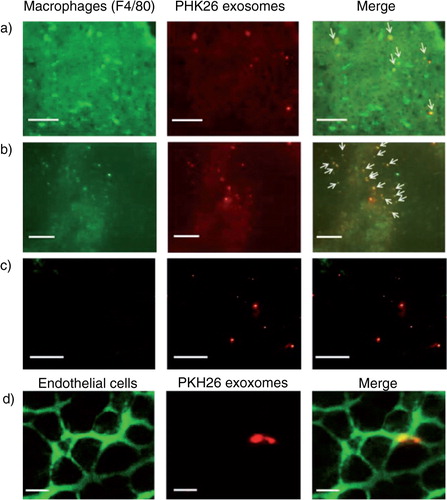
Fig. 4. Clearance of gLuc-LA labelled B16BL6 exosomes from the blood circulation. gLuc activity in the serum of untreated mice (open symbols) and macrophage-depleted mice (closed symbol) was sequentially measured after intravenous injection of gLuc-LA-labelled exosomes derived from B16BL6 cells at the doses of 1.25 (triangle), 2.5 (square) or 5 µg (circle). Results are expressed as the mean of the percentage of injected dose/mL (% ID/mL) + SD of 4 mice. *p < 0.05 versus untreated mice at the same dose.
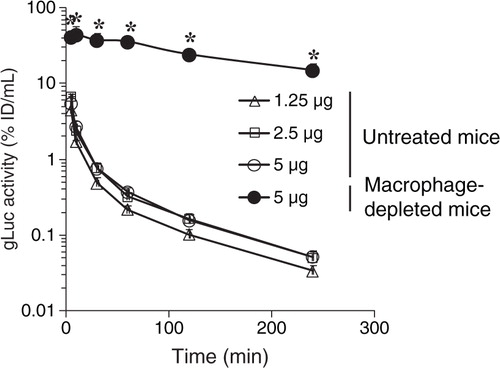
Table I. Effect of exosome dose and macrophage depletion treatment on pharmacokinetic parameters of exosomes
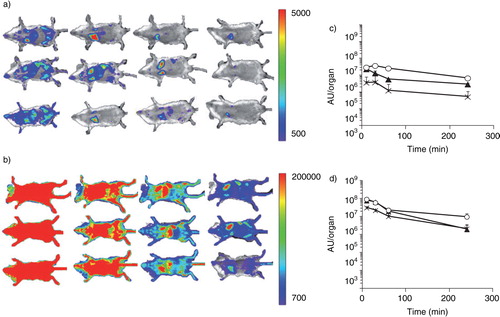
Fig. 5. Visualization of traffic of intravenously injected B16BL6 exosomes. (a, b) Untreated mice (a) and macrophage-depleted mice (b) were administered gLuc-lactadherin (gLuc-LA)-labelled B16BL6 exosomes. B16BL6 cells labelled with gLuc-LA were imaged 10, 30, 60 and 240 min (from left to right) after intravenous injection of exosomes through a bolus intravenous injection of coelenterazine. (c, d) Time course of chemiluminescence intensity in regions of the liver (closed triangle), spleen (crossed symbols) and lung (open circle) after intravenous injection of gLuc-LA-labelled exosomes into untreated mice (c) or clodronate liposome-treated mice (d). Results in (c) and (d) are expressed as mean + SD of 3 mice.