Figures & data
Fig. 1. DiR labelling does not affect EV morphology and co-localizes with EVs. (A) Western Blot (WB) stained for Alix and Tsg101 on HEK293T purified, DiR-labelled EVs and cell lysate (CL) (whole WB-membrane shown in Supplementary Fig. 1A). (B) NTA profile of DiR-labelled HEK293T EVs showing an EV-like distribution with a mode size around 100 nm. The curve has been normalized to dilution factors. (C) Electron microscopy picture of DiR-labelled HEK-293T EVs. Scale bar represents 100 nm. (D) Image depicting DiR-EVs and free DiR sucrose gradients in UC tubes and subsequent 12-well plates containing the different fractions. (E) Fluorescent values (normalized to background) of the DiR-EVs and free DiR gradients (assayed from the 12-well plates depicted in 1D). (F) WB stained for Alix for DiR-EVs from fractions 2–10 (whole WB-membrane shown in Supplementary Fig. 1B).
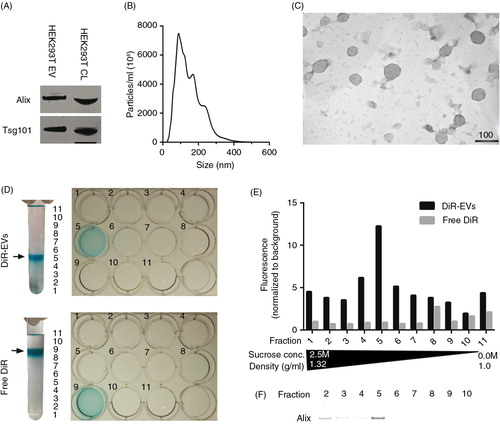
Fig. 2. Systemically delivered EVs display a dose-dependent increase in tissue uptake in mice. (A) Representative IVIS image 24 hours post-injection of a live mouse injected i.v. with 1.0×10¹⁰ p/g DiR-EVs (left) and PBS-treated control (right). (B) Representative co-registration of FLIT with CT-scan 24 hours post-injection of a mouse injected i.v. with 1.0×10¹⁰ p/g DiR-EVs. (C) Fluorescent signal in each organ 24 hours post-iv injection of HEK293T-EVs (1.0×10¹⁰ p/g) with (HEK293T-p) and without (HEK293T) perfusion and free OptiMEM-DiR. Misc.=brain, heart, kidneys and quadriceps muscle. N=4. The results represent mean+SEM. (D) Representative IVIS images of organs (24 hours post-injection) from mice injected i.v. with 1.5×10¹⁰ p/g, 1.0×10¹⁰ p/g and 0.25×10¹⁰ p/g of HEK293T EVs. (E) The percentage of fluorescent signal in each organ for the same experiment as in D (Absolute fluorescent signals are plotted in Supplementary Fig. 3). N=4, in E *represents p=0.05, **p=0.001 and ****p=0.0001. The results represent mean+SEM.
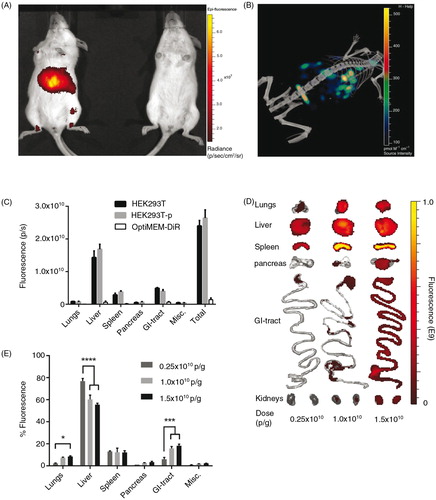
Fig. 3. Distribution kinetics and effect of different injection routes of DiR-labelled EVs on tissue distribution. (A) Percentage fluorescent signal of each organ ex vivo at different time points after injection of 1.0×10¹⁰ p/g DiR-labelled HEK293T EVs (fluorescent signal in absolute numbers in Supplementary Fig. 4). (B) Percentage fluorescent signal in each organ following i.p., s.c. and i.v. injection of 1.0×10¹⁰ p/g DiR-labelled HEK293T EVs (Absolute fluorescent signals are plotted in Supplementary Fig. 5b). Misc.=brain, heart, kidneys and quadriceps muscle. N=3–4, **represents p<0.01, ***p<0.001 and ****p<0.0001. The results represent mean+SEM.
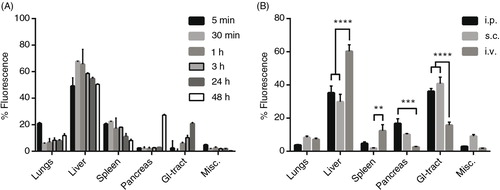
Fig. 4. The biodistribution of EVs differs between cell sources. (A) Particle distribution of DiR-labelled EVs from mouse C2C12-, B16F10- and DC-cells measured by NTA. (B) Western Blot stained against Alix and Tsg101 of EVs from C2C12-, B16F10- and DC-cells (whole WB-membranes in Supplementary Fig. 7). (C) The percentage of fluorescent signal in each organ after injection of 1.0×10¹⁰ p/g DiR-labelled EVs from the 3 different mouse cell types (Absolute fluorescent signals are plotted in Supplementary Fig. 8). Misc.=brain, heart, kidneys and quadriceps muscle. (D) Representative spleen, liver and lung IVIS images from mice injected with EVs from the 3 different mouse cell sources and PBS-treated control. N=4, in C *represents p=0.05, ***p=0.001 and ****p=0.0001. The results represent mean+SEM.
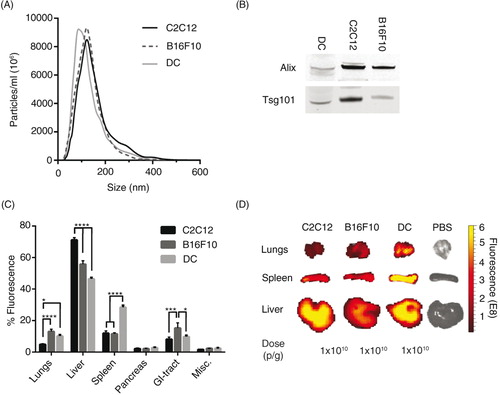
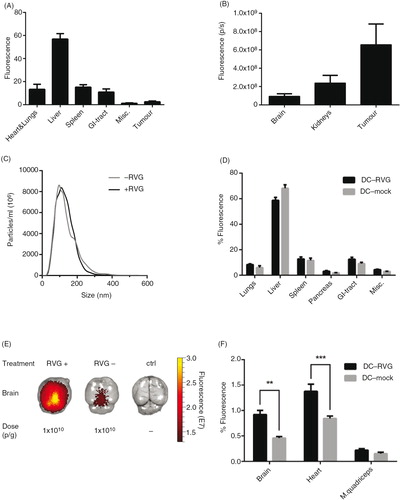
Fig. 5. EVs distribute to tumour tissue and can be targeted to the brain. (A) The percentage of fluorescent signal in each organ of tumour-bearing mice after injection of 1.0×10¹⁰ p/g HEK293T DiR-labelled EVs (Absolute fluorescent signals are plotted in Supplementary Fig. 9). (B) Fluorescent signal from tumour, kidneys and brain shown from the same mice described in A. (C) NTA of RVG-positive (+RVG) and RVG-negative (-RVG) DC-EVs. (D) The percentage of fluorescent signal in each organ after injection of 1.0×10¹⁰ p/g of +RVG and –RVG DC-EVs (Absolute fluorescent signals are plotted in Supplementary Fig. 10). (E) Representative image of mouse brains, harvested 24 hour post-injection of 1.0×10¹⁰ p/g of +RVG and –RVG DC-EVs. (F) The percentage of fluorescence signal in the brain, heart and muscle from the same mice as shown in D (Absolute fluorescent signals are plotted in Supplementary Fig. 11). Misc.=brain, heart, kidneys and quadriceps muscle. N=4, **represents p<0.01 and ***represents p<0.001, the results represent mean+SEM.