Figures & data
Fig. 1. LMP1 accumulates at and signals from CD63+ endosomes. (a) Immunofluorescent labelling of wtLMP1 (red) and CD63 (green) in HEK293 cells. (b) Immunofluorescent labelling of wtLMP1 in HEK293 cells with endogenous CD63 levels or overexpression of CD63. White and red arrowheads indicate LMP1 localized at the plasma membrane or endosomal membranes, respectively, and N indicates nucleus. (c) Reporter assay for effect of CD63 on LMP1-wt NFκB activity. Cell lysates of HEK293 cells transfected for 24 hours with wtLMP1 (LMP1-WT) and increasing amounts of CD63 plasmid or empty vector (control), together with an NFκB–reporter construct. Error bars represent s.d.; shown is one representative experiment; n=3. (d) Immunofluorescent labelling of LMP1-wt or LMP1ΔTM1-2 (LMP1 ΔTM) (both in red) in HEK293 cells co-transfected with Rab5- or Rab7-GFP (both in green). N indicates nucleus. (e) Immunofluorescent labelling of Lysotracker (red) in LMP1-wt or LMP1 ΔTM (green) transfected HEK293 cells. N indicates nucleus. (f) Reporter assay for LMP1-wt or LMP1-ΔTM1-2 NFκB activity. Cell lysates of HEK293 cells transfected with wtLMP1 (LMP1-WT), LMP1-ΔTM1-2 (LMP1-ΔTM1-2), or empty vector (control), together with an NFκB–reporter construct. Error bars represent s.d.; shown is one representative experiment; n=3.
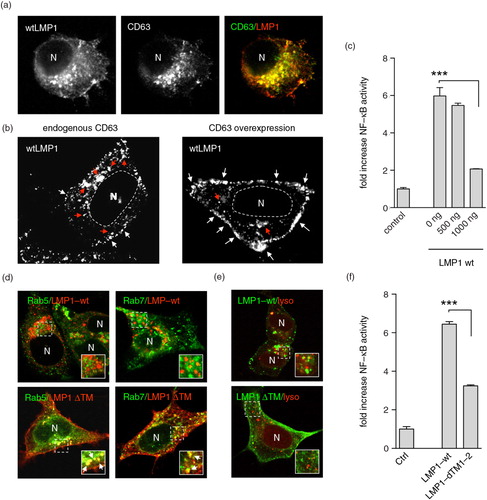
Fig. 2. LMP1–TRAF2 association at endosomal membranes controls signalling and sorting. (a) Immunofluorescent labelling of endogenous TRAF2 and TRAF3 (all in green) in wtLMP1 (red) transfected HEK293 cells. Lower panel: Immunofluorescent labelling on EBV-negative BJAB cells carrying a tetracycline-inducible (TET-Off) LMP1 expression construct, induced for 24 hours (LMP1 in red) and labelled for endogenous TRAF2 (green). N indicates nucleus. (b) Immunofluorescent labelling of endogenous TRAF2 (green) in HEK293 cells transfected with LMP1 constructs with point mutations in (LMP1 DM) the suspected TRAF-binding sites (red). N indicates nucleus. (c) Reporter assay for LMP1-wt or LMP1-DM NFκB activity. Cell lysates of HEK293 cells transfected for 24 hours with wtLMP1, LMP1-DM, or empty vector (control), together with an NFκB–reporter construct. Error bars represent s.d.; shown is one representative experiment; n=3. (d) Western blotting analysis on TRAF2 and LMP1 protein levels in EBV-infected LCL cell and exosome lysates (left) and in wtLMP1-transfected HEK293 cell and exosome lysates (right). (e) Western blotting analysis on LMP1 protein levels in wtLMP1– or LMP1-DM-transfected HEK293 cell and exosome lysates.
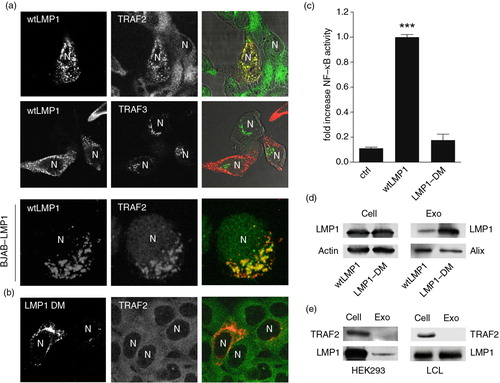
Fig. 3. Palmitoylation controls subcellular trafficking of LMP1 but not TRAF2 association. (a) Immunofluorescent co-labelling of transfected wtLMP1 or LMP1-C78A (red) in HEK293 cells. N indicates nucleus. (b) Immunofluorescent labelling of endogenous TRAF2 (green) in HEK293 cells transfected with wtLMP1 or LMP1-C78A (red). To the right, reporter assay for LMP1-wt or LMP1-C78A NFκB activity. Cell lysates of HEK293 cells transfected for 24 hours with wtLMP1 or LMP1-C78A, together with an NFκB–reporter construct. Error bars represent s.e.m.; n>3. N indicates nucleus. (c) Immunofluorescent labelling of transfected wtLMP1 in 2BPA and control treated HEK293 cells. N indicates nucleus. (d, e) Immunofluorescent labelling of constitutive active Src-wt CA, Src-S3C CA, Fyn-wt CA, or Fyn-C3S CA (all in green) transfected HeLa-CIITA cells, co-labelled for CD63 (red). N indicates nucleus. (f) Table showing the enrichment of proto-oncogenes in exosomes versus cell lysates from 6 different B-cell lines referenced to the total number of peptides identified in each analysis.
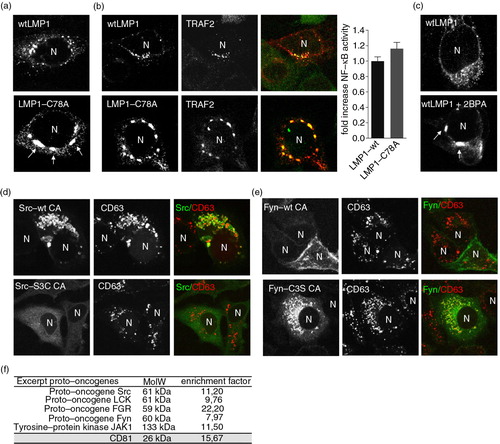
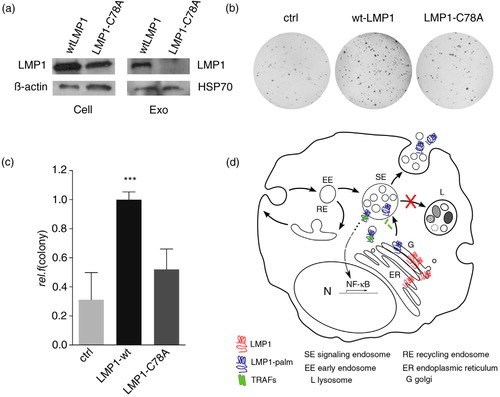
Fig. 4. Palmitoylation controls LMP1 transformation capacity. (a) Western blotting analysis on LMP1 protein levels in wtLMP1 or LMP1-C78A transfected HEK293 cell and exosome lysates; β-actin and HSP70 as loading controls. (b, c) Soft-agar assay for anchorage-independent growth of HEK293 cells transfected with wtLMP1, LMP1-C78A, or GFP control (ctrl) construct. Error bars represent s.e.m.; n>3. (d) Hypothetical model showing that newly synthesized LMP1 (blue) assembles with CD63 in the ER; traffics to the Golgi (G), where it is palmitoylated (red); and buds off in CD63-positive transport vesicles that form or assemble at limiting membranes of signalling endosomes (SEs). Whereas palmitoylation targets LMP1 to SE membranes, non-palmitoylated LMP1 is retained in the ER–Golgi region. Wild-type LMP1 recruits TRAF2, and the activated signalling complexes accumulate at endosomal membranes activating NFκB. Upon LMP1 sorting into the intra-luminal vesicles, LMP1 is then secreted via exosomes while TRAF2 dissociates and is presumably left behind in the cytosol.