
Figures & data
Table I. Selected baseline patient characteristics for the two study groups
Table II. Description of the markers selected for the EV Array together with the outcome (p-value) of the non-parametric t-test comparing the log2 transformed data from the control group and the cancer group (Supplementary Fig. 1a and b)
Fig. 1. Hierarchical cluster analysis. Two groups of markers show co-variance both in the control group and in the cancer group (marked with boxes). a) Heat map illustration of all markers in the control group. b) Heat map illustration of all markers in the cancer group.
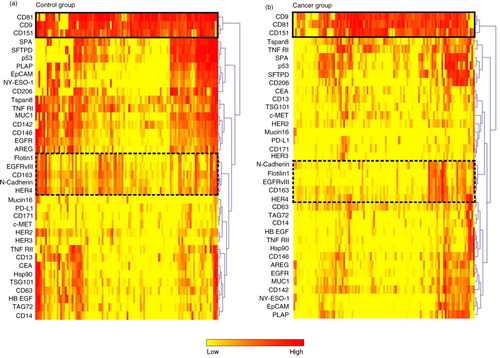
Fig. 2. EV Array signal intensities for selected antigens. a) The EV Array signal intensities for the exosomal markers CD9, CD63 and CD81 displayed in box plots. The co-variation of the signal intensities across the patient samples can be seen in Fig. 1 and Supplementary Fig. 2. b) Box plot of a group of antigens (Flotilin-1, HER4, EGFRvIII, N-Cadherin and CD163) showing a high degree of co-variation (see ). *p<0.05; ***p<0.001; ****p<0.0001; ns=not significant.
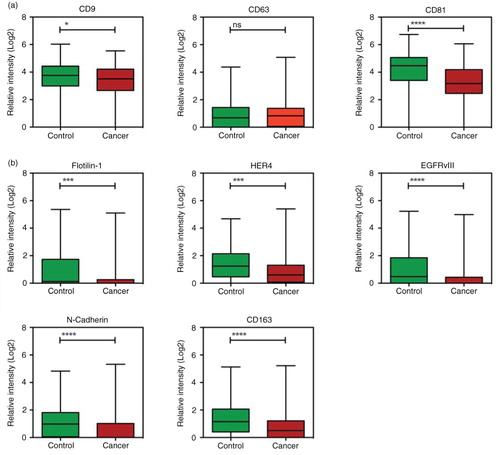
Fig. 3. Normalisation of the data to the total amount of signal. a) The signals for all analytes were summed for each individual patient and plotted; controls indicated with green and cancer with red. For each individual patient the expression of the analytes were calculated as percentage of the total signal. The pie charts illustrate an example of the normalised data for a patient in each group with a total amount of signal of ~40. Highlighted is the expression of CD9, CD63 and CD81. b) and c) Box plot of the relative expression of markers from a and b in percentage (in relation to the total sum of exosomal signal). *p <0.05; **p<0.01; ****p<0.0001; ns=not significant.
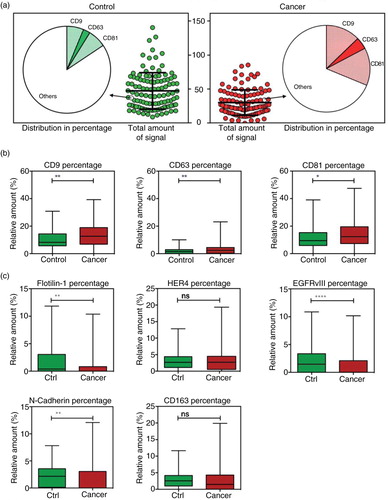
Fig. 4. Multivariate analysis by Random Forests using the EV Array measurements of the exosomal antigens. Random Forests ROC curves generated by the cross validation performance. The area under curve (AUC) for top 3-, 5-, 10-, and 30-marker panels are given together with the 95% confidence interval.
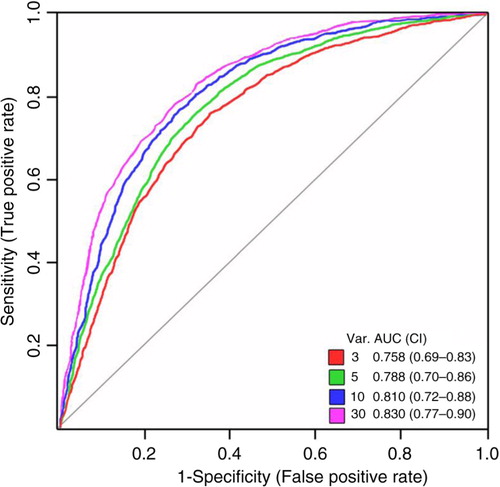
Fig. 5. Multivariate analysis by Random Forests using the EV Array measurements of the exosomal antigens. The mean average importance to the classification model using the 30-marker panel illustrated in for each of the analysed exosomal antigens, the normalised values (indicated by “*”) and their internal relations (indicated by “/”). The top 10 ranking did not change between the models including 3-, 5-, 10- or 30-markers and the markers included in each model are visualised by the coloured lines. Colours refer to the number of variables showed in .
