Figures & data
Fig. 1. (Continued).
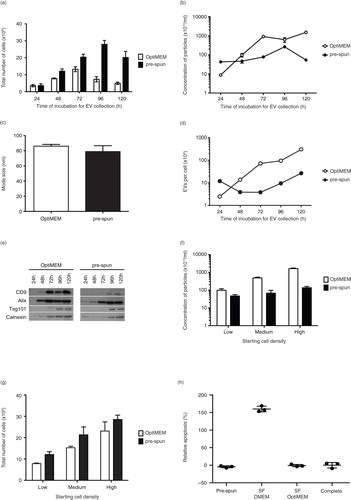
Fig. 1. Comparison of N2a cells and EVs cultured and collected under either OptiMEM or pre-spun conditions over a 5-day period. Total number of adherent N2a cells (a) and concentration of particles (b) derived from N2a conditioned media cultured under OptiMEM and pre-spun conditions across a 5-day period. (c) Average mode size of the particles isolated from OptiMEM and pre-spun conditions. (d) Ratio of the total number of EVs per cell isolated from OptiMEM or pre-spun conditioned media. (e) Representative western blotting pictures showing the appearance of EV markers (CD9, Alix and Tsg101) and ER marker (Calnexin) in the EVs isolated across the 5-day period. Equal volumes of the re-suspended EV pellets, representing 20% of total EV yield, were loaded in the gel. (f) Concentration of particles derived from N2a cells conditioned media seeded at different starting densities, over a fixed 48 h period of culture from either OptiMEM or pre-spun conditions. (g) The total number of adherent N2a cells in the flasks after the 48 h period of culture for both OptiMEM and pre-spun conditions. (h) Relative apoptosis (%) levels in N2a cells after 48 h in the different media types. Complete represents normal growth conditions (DMEM + 10% FBS). 100% apoptosis level is determined with 10 μM of staurosporin treatment for 4 h. (i) The total number of adherent N2a cells in the flasks after the 48 h period of culture in the 3 different media types. (j) Concentration of particles derived from N2a cells conditioned media after 48 h. (k) Representative western blotting pictures showing the appearance of EV markers (Alix and Tsg101) and ER marker (Calnexin) in the particles isolated after 48 h.
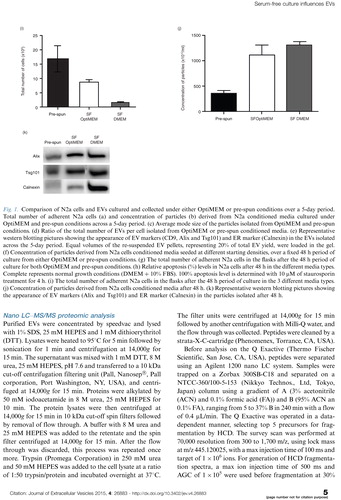
Fig. 2. Characterization of N2a cells and EVs cultured and collected under either OptiMEM or pre-spun conditions at a fixed 72 h period. (a) Representative western blotting pictures showing the enrichment of EV markers (CD9 and Alix) in the EVs as compared to the parental cell lysates, while the opposite trend is noticed for the ER marker, Calnexin. Forty micrograms of cell lysate or EVs was loaded in the gel. (b) Representative western blotting pictures showing the appearance of EV markers and Calnexin at 1.10–1.18 g/mL after floating EVs on a continuous sucrose gradient for 16 h.
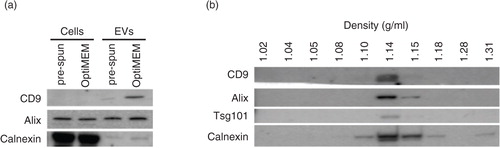
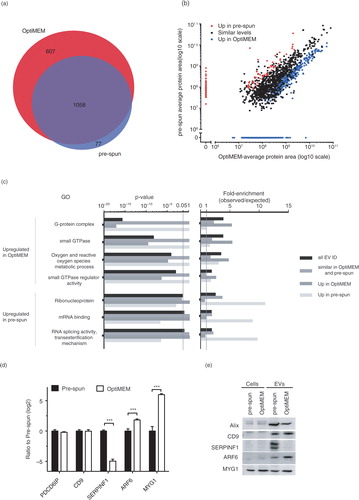
Fig. 3. (Continued). Fig. 3. Nano LC–MS/MS proteomic analysis of N2a EVs isolated from either OptiMEM or pre-spun conditions collected after 48 h period. (a) Venn diagram showing a 60% overlap of total proteins identified in EVs from both OptiMEM and pre-spun conditions. (b) Scatter plot showing the correlation between the expression levels of proteins identified in EVs isolated from either OptiMEM or pre-spun conditions. Proteins are further classified into 3 groups: similar levels in both conditions (black dots), higher expression in pre-spun (red dots) and higher expression in OptiMEM (blue dots). (c) A subset of significantly enriched GOs from proteins considered to be up-regulated in either OptiMEM or pre-spun-derived EVs. All proteins are grouped under the 4 categories: all EV IDs (black bar), proteins of similar levels in both OptiMEM and pre-spun (grey bar), higher in OptiMEM (dark grey bar) and higher in pre-spun (light grey bar). (d) Proteomics data showing the ratio of OptiMEM/pre-spun (log 2) on the selected proteomic validation targets (Alix/PDCD6IP, CD9, SERPINF1, ARF6 and MYG1) (***p < 0.001, 1% FDR). (e) Representative western blots on these selected validation targets in both cells and EVs cultured and collected under either OptiMEM or pre-spun conditions.