Figures & data
Fig. 1. The NSCLC SK-MES-1 cell line produces exosomes that can be isolated with ultrafiltration of CCM. (a) 5 µg of protein was used for Western blot analysis of isolated exosomes. The presence of canonical exosome proteins, and the absence of Calnexin demonstrates a pure exosome preparation. (b) TRPS analysis demonstrates a size distribution of particles consistent with the size range of exosomes. (c) EM image of exosomes demonstrates cup-shape morphology, size bar=200 nm. CL: cell lysate; E: exosome lysate.
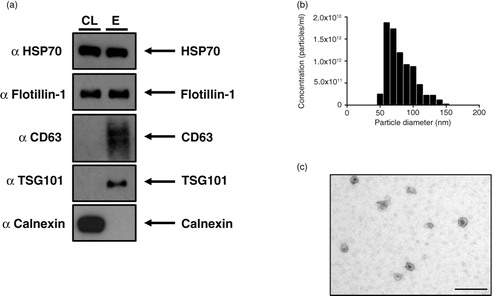
Fig. 2. The choice of concentrating method impacts on particle recovery. (a) Significant reduction in the yield of <100 nm particles was observed with the first run of a membrane using the pressure-driven concentrating Stirred Cell device, but not the centrifuge-based Centricon device. (b) Particle yield from membranes restored with NaOH remained low with the Stirred Cell, but was not altered with the Centricon concentrator. (c) <100 nm particle yield from the Stirred Cell was comparable to Centricon concentration when membranes were washed with ethanol. n=3±SEM, ***p<0.001. SC: Stirred Cell.
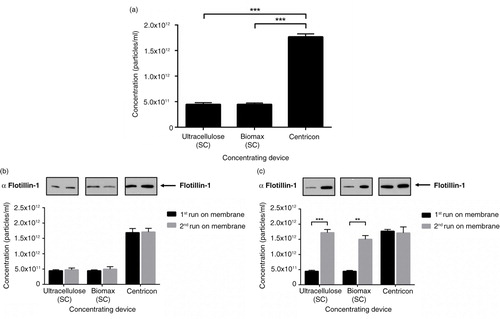
Fig. 3. Ultrafiltration recovers more particles compared to ultracentrifugation. (a) Size distribution of particles before density gradient purification. (b) Percentage of particle size ranges from ultracentrifugation and ultrafiltration isolations. (c) Ultrafiltration was shown to significantly increase the recovery of <100 nm particles compared to ultracentrifugation; n=3±SEM, *p<0.05. (d) Western blot analysis of equal volumes from ultracentrifugation and ultrafiltration did not show a large difference in protein markers for exosomes. UC: ultracentrifugation; UF: ultrafiltration.
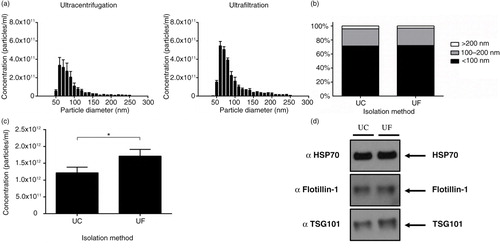
Fig. 4. Ultrafiltration of CCM results in higher recovery of particles after density gradient purification. (a) Particle analysis of 1 mL fractions collected from density gradient. Ultracentrifugation results in a significantly higher proportion of particles at higher densities in fractions 8–10. (b) Total particles (<100 nm) isolated from ultracentrifugation and ultrafiltration. Ultrafiltration of CCM before density gradient purification results in a higher yield of <100 nm particles compared to ultracentrifugation preparation. (c) Percentage recovery of particles collected from fraction 6 and 7 is higher with the ultrafiltration protocol compared to ultracentrifugation. (d) Size distribution of particles isolated from both protocols indicates no difference in size profile of particles isolated. (e) EM images of exosomes isolated with ultracentrifugation and ultrafiltration protocols, size bar=200 nm. n=3±SEM, *p<0.05. UC: ultracentrifugation; UF: ultrafiltration.
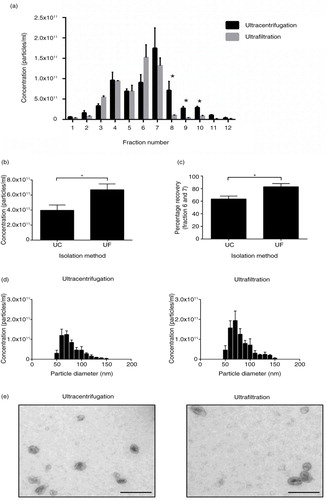
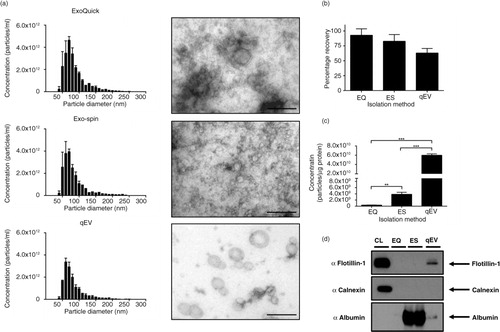
Fig. 5. Alternative rapid isolation techniques of exosomes from concentrated media. (a) Size distribution and EM images of particles isolated from precipitation methods and qEV SEC columns, size bar=200 nm. (b) Precipitation methods isolate significantly more particles (<100 nm) compared to SEC and density gradient purification. (c) Concentration of particles expressed as a ratio per microgram of protein. Both SEC and DG provide superior purity as illustrated by significantly more particles per microgram of protein compared to precipitation protocols. (d) No difference was observed in the particle size composition of different isolation methods. (e) Western blot analysis of 10 µg of protein from each protocol. Exosome-positive markers were enriched in qEV and DG lysates compared to precipitation isolations, and all isolation techniques were absent for Calnexin, which was present only in the cell lystate fraction. n=3±SEM, *p<0.05, **p<0.01, ***p<0.001. CL: cell lysate; EQ: ExoQuick™; ES: Exo-spin™; qEV: size exclusion columns; DG: density gradient.
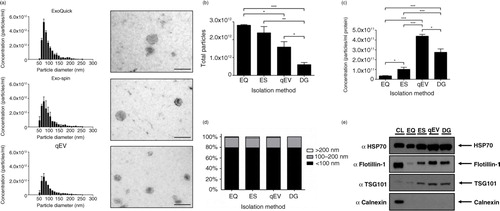
Fig. 6. Exosomes isolated from plasma. (a) Size distribution profiles and EM images indicated all 3 protocols isolated particles of the correct size, size bar=200 nm. (b) Percentage recovery of particles in relation to unprocessed plasma showed no difference between EQ, ES and qEV. (c) Particle/protein ratio indicated that SEC using qEV columns significantly outperformed both EQ and ES. (d) Western blot analysis of 50 µg of protein indicated that all 3 methods were absent for Calnexin; however, Flotillin-1 could only be detected in the qEV lysate. The presence of non-exosomal contaminating proteins in EQ and ES samples was demonstrated with the abundance of albumin, which was almost absent in the qEV sample. n=3±SEM, **p<0.01, ***p<0.001. CL: cell lysate; EQ: ExoQuick™; ES: Exo-spin™; qEV: size exclusion columns.