Figures & data
Fig. 1. Characterizing a column-based separation of vesicles in cell culture–derived medium. (A) A commercially obtained chromatography column (Cell Guidance Systems, Cambridge, UK) was loaded with 1 ml pre-cleared cell-conditioned medium, and washed with PBS. (B) A total of 24 fractions of 500 µl were collected. An aliquot of 5 µl was used to determine nanoparticle concentration (by NanoSight™), and 20 µl was used for the microBCA protein assay. (C) Equal volumes (50 µl) from each fraction were also immobilized onto high-protein-binding ELISA plates overnight, and after blocking they were stained with antibodies against CD9, CD81, CD63, MHC Class-I, Apo-B, HSA or an isotype control, as depicted. (D) From the protein and NanoSight™ data, the particle-to-protein ratio was calculated. (D, inset) The Western blot panel (inset) was performed using 15 µl of selected fractions and shows weak but visible bands for TSG101.
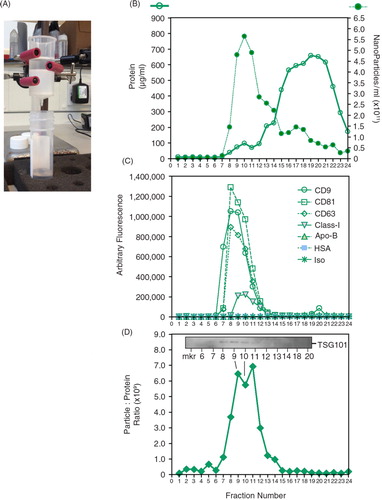
Fig. 2. Evaluating the reproducibility of column separation. Three columns were run in parallel with the same culture medium sample, and the assorted assays performed for each column fraction series include immunostaining for exosome markers (A), nanoparticles (measured by NanoSight™) and protein assessment (measured by both microBCA assay and NanoDrop™; absorbance at 280nm) (B) and particle-to-protein ratio (C), revealing in each case comparable performance across the 3 columns tested. #denotes fractions where NTA was not performed.
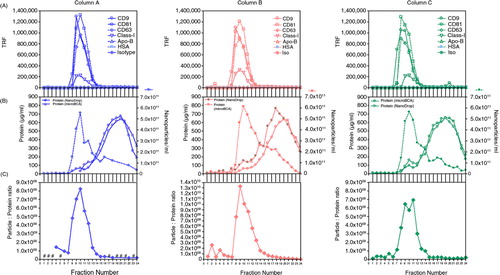
Fig. 3. Characterizing column-based separation of vesicles in plasma. A chromatography column was loaded with 1.5 ml pre-cleared plasma, and washed with PBS–EDTA, and a total of 30,500 µl fractions was collected. The concentration of nanoparticles and protein (by NanoDrop™) was assessed (A), and the fractions were stained for CD9 (B) or human serum albumin (HSA) (C). The particle-to-protein ratio measurements are shown in (D); for fractions 1–7, where proteins were below detection limits, this ratio could not be calculated.
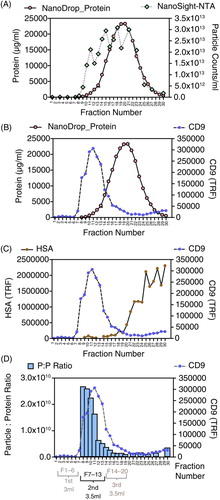
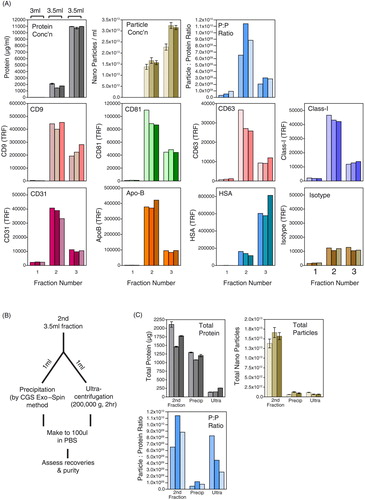
Fig. 4. Simplifying and concentrating column-based separation of vesicles in plasma. A chromatography column was loaded with 1 ml pre-cleared plasma and washed with PBS–EDTA, and 3 large-volume fractions were collected: fraction-1 (3 ml), fraction-2 (3.5 ml) and fraction-3 (3.5 ml). Protein (by NanoDrop™; grey bars), nanoparticles (NanoSight; brown bars) and the particle-to-protein ratio (blue bars) are shown. Immunostaining for a range of specified markers was also performed (A). Fraction-2, which putatively contained the purest vesicles, was split into equal aliquots of 1 ml and concentrated by chemical precipitation or by high-speed ultracentrifugation as depicted (B). The pellets were collected, and recoveries in terms of protein, particles and purity (particle-to-protein ratio) were compared to the pre-concentration step (C).