Figures & data
Fig. 1. Diagram of the isolation procedure and the initial analysis of the fractions.
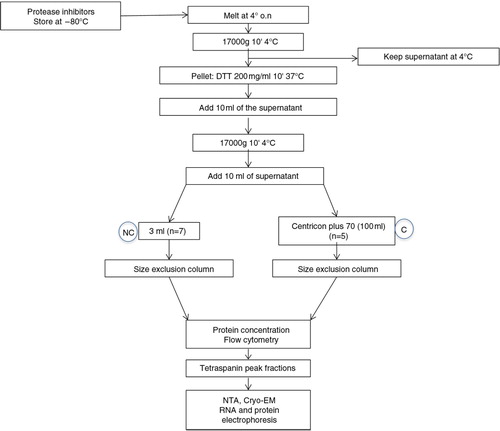
Fig. 2. Total protein concentration in SEC fractions.
Bradford assay results of non-concentrated (n=7, panel a) and concentrated (n=5, panel b) samples from healthy donors (HD). In both graphs, the x-axes show the collected fractions and the y-axes represent the protein concentration (mg/mL).
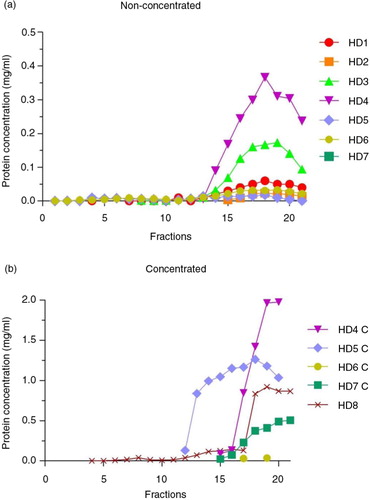
Fig. 3. Urine EVs are eluted in low protein containing SEC fractions.
In panel a, a representative analyses of a SEC processed sample is shown. In each fraction (indicated on the x-axis), the expression of CD9 and CD63 and the total protein content were determined. The left axis shows the total protein content (mg/mL), whereas the right axis shows the median fluorescence intensity (MFI) data for CD9 and CD63. The isotype control for flow cytometry assay is depicted by a dotted line.
In panel b, fractions showing the highest MFI value for each CD marker (CD9 square symbols and CD63 triangle symbols) were grouped (n=10). Fractions in which protein content was first detected are also shown (circles, n=8). Higher CD9 and CD63 MFI values were routinely detected between fractions 7 and 10, well before any protein elution was detectable.

Table I. Size distribution and EVs concentration from NTA analyses
Fig. 4. Analyses of the EVs obtained after SEC procedure by NTA.
Representative NTA analyses of the tetraspanin-peak fractions from HD4 (non-concentrated, left) and HD4C (concentrated, right) urine samples.
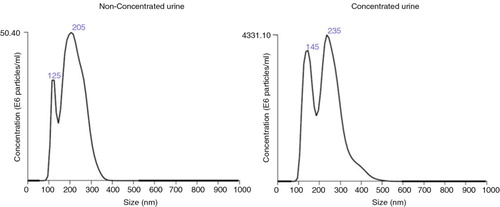
Fig. 5. Analyses of the EVs obtained after SEC procedure by cryo-EM.
Panel a shows a cryo-EM of vesicles contained in a tetraspanin-peak fraction from non-concentrated (left) and concentrated (right) samples. Scale bar is 500 nm. Arrows pointing at EVs. In panel b, the size of these vesicles was measured (diameter in nm) from a set of images of non-concentrated (left, n=36 EVs from 10 images) and concentrated (right, n=63 EVs, from 17 images) samples using ImageJ software (NIH).
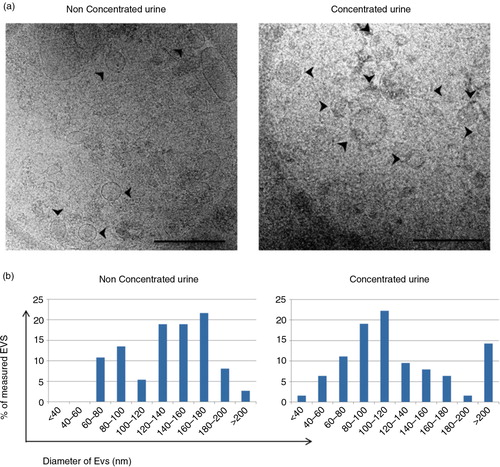
Table II. Summary of proteomic results
Fig. 6. EV fractions from concentrated urine are enriched in protein content.
Coomassie blue stained SDS–PAGE of the concentrate urine (lane C), the 17,000g pellet (lane 17,000g) and 7 fractions including the tetraspanin-peak fractions (F8–F12) and 2 later fractions (F19 and F20) are shown in panel a. Molecular weight is indicated in the first lane (MW). THP and albumin bands are indicated in the gel.
In panel b, silver staining of the same SDS–PAGE showing the protein content of tetraspanin-peak fractions. THP and albumin bands are also indicated.
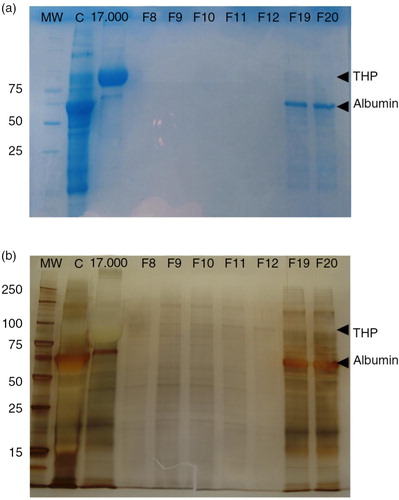
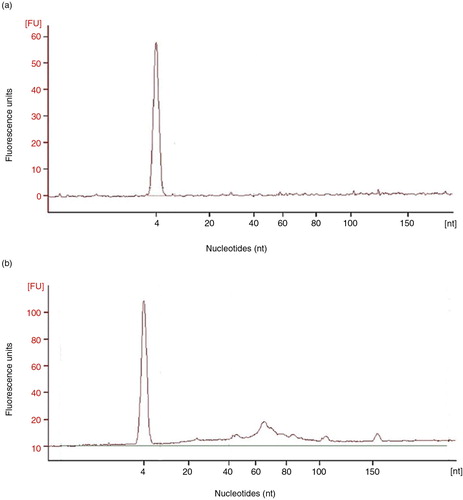
Fig. 7. Analyses of the RNA content of SEC fractions.
Panel a shows a representative (n=3) bioanalyser profile of small RNA of a single tetraspanin-peak fraction obtained from a non-concentrated sample, HD5. In panel b, bioanalyser profile of a concentrated, HD5C, sample is shown.