Figures & data
Fig. 1. Human bronchial epithelial cell-derived EVs are transported to primary lung fibroblasts (LFs). (a) Electron microscopy images of BEAS-2B- and HBEC-derived EVs, showing a size of approximately 50–150 nm in diameter. (b) Western blot of these cell-derived EVs for CD81, CD9, annexin A2 and HSP70. (c) HBECs (upper panel) and HBEC-derived EVs (lower panel) were analysed with a bioanalyser. Gels and electropherograms are shown. The left gel lane is the ladder standard, and the right lane is the total RNA from HBECs and HBEC-derived EVs. The y-axis of the electropherogram shows the signal intensities in arbitrary fluorescence units (FU), and the x-axis shows the size of the RNA in nucleotides (nt). (d) Schematic representation of the EV uptake experiment. BEAS-2B- and HBEC-derived EVs were labelled with PKH67 and incubated with primary LFs. (e) Purified BEAS-2B- and HBEC-derived EVs or vehicle PBS(-) as a control was labelled with PKH67 (green) and incubated with primary LFs. Nuclei were counterstained with DAPI (blue). Scale bar: 20 µm.
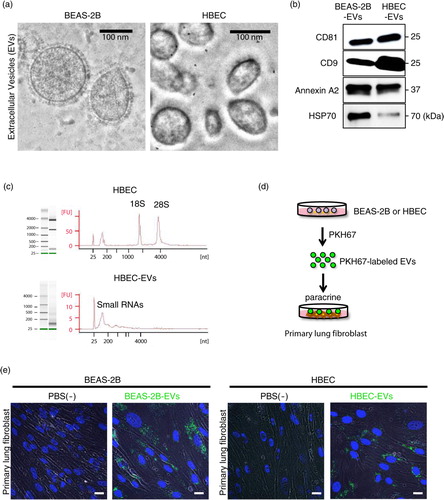
Fig. 2. CSE-induced HBEC-derived EVs promote a lung myofibroblast differentiation phenotype. (a) Schematic representation of the conditioned medium collected (on days 4 and 6) after HBECs (passage ≤ 4) was incubated with or without a low concentration of CSE (1.0%) for 2 days. MC: medium change. (b) Cell proliferation assay of HBECs with or without 1.0% CSE (days 0–2). (c and d) Nanoparticle tracking analyses of the particle size (c) and counts (d) in non-treated HBEC-derived EVs or CSE-induced HBEC-derived EVs. (e) Western blot of senescent markers and fibrotic markers by CSE-induced HBEC-derived EVs or non-treated HBEC-derived EVs in primary lung fibroblasts (LFs). (f) Immunofluorescence staining for collagen type I (red) and α-SMA (green) in primary LFs with CSE-induced HBEC-derived EVs or non-treated HBEC-derived EVs was evaluated by confocal microscopy. DAPI (blue) was used for nuclear staining. Scale bar: 20 µm.
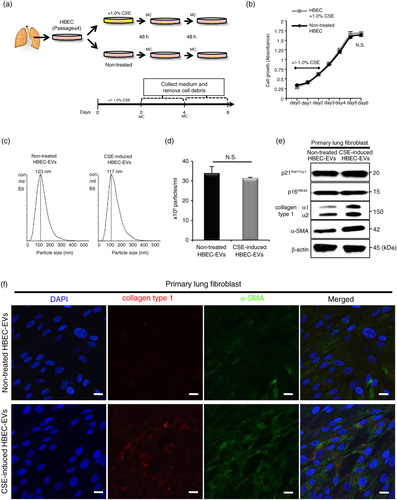
Fig. 3. HBEC-derived EV miR-210 promotes lung myofibroblast differentiation. (a) A heat map of the EV miRNA microarray analysis revealed differentially expressed miRNAs (change >1.5-fold) in CSE-induced HBEC-derived EVs or non-treated HBEC-derived EVs. (b) qRT-PCR validation of EV miRNAs from the 2 EV groups. miR-16 was used as an internal control. (c) qRT-PCR analyses of miR-210 expression levels in non-smoker or smoker lungs (including non-COPD smokers and COPD patients; P=0.049). (d) miR-210-specific probe, scramble control probe and β-actin were hybridized in situ with normal lung tissue. Original magnification, 200×. (e) A transwell co-culture assay with transfected HBECs (top well) and primary lung fibroblasts (LFs) (bottom well). A 0.4-µm porous membrane is between the 2 wells, inhibiting cell–cell contact. (f) A co-culture assay to study the miRNA cargo from HBECs to primary LFs. HBECs were transfected with a Cy3-labelled miRNA (red) or a control precursor miRNA (non-labelled). Nuclei were counterstained with DAPI (blue). Scale bar: 50 µm. (g) miR-210 expression in LFs after 72 h co-culturing with HBECs transfected with miR-210 mimic (pre-miR-210) or miR-NC. RNU6B was used as an internal control. (h) Western blot of fibrotic markers in primary LFs (the bottom well) in the co-culture assay. HBECs were transfected with a precursor of miR-210 (pre-miR-210) or a control precursor miRNA (pre-miR-NC) and co-cultured with primary LFs for 72 h. *P<0.05. NC: negative control.
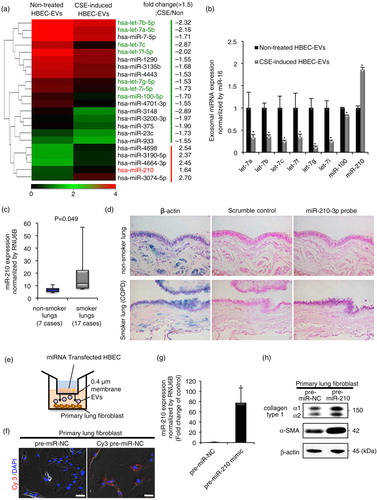
Fig. 4. miR-210 directly targets ATG7 in lung fibroblasts (LFs), leading to a modulating autophagy process. (a) Western blot of ATG7 in LF homogenates from non-COPD (n=5) and COPD patients (n=4). The right panel shows the average taken from 3 independent experiments shown as the relative expression of ATG7 as compared with that of β-actin. (b) Western blot of LC3 in LF homogenates from non-COPD (n=5) and COPD patients (n=4) in the presence of protease inhibitors (E64d and pepstatin A). The right panel shows the average taken from 3 independent experiments shown as the relative expression of LC3-II as compared with that of β-actin. (c) The relationship between relative ATG7 expression normalized to β-actin and the percentages of FEV1/FVC (n=9). (d) The relationship between relative ATG7 expression normalized to β-actin and miR-210 expression normalized to RNU6B (n=9). (e) Western blotting of ATG7 and fibrotic markers in primary LFs transfected with ATG7-siRNA or siRNA-NC. (f) Western blot of ATG7 and fibrotic markers in primary LFs transfected with pre-miR-210 or pre-miR-NC. (g) Schematic miR-210 putative target sites in the 3′ UTRs of ATG7 and the sequence of mutant UTRs. (h) The effect of co-transfection of pre-miR-210 with wild-type (Wt) and mutant (Mut) psiCHECK2 vectors with each gene construct in MRC5 cells was measured using luciferase reporter assays. (i) LC3 western blotting of primary LFs transfected with pre-miR-210 or pre-miR-NC in the presence or absence of protease inhibitors (E64d and pepstatin A). (j) Fluorescence microscopic detection of pEGFP-LC3 dot formation in primary LFs. The right panel is the percentage of positive cells with more than 5 dot formations. (k) LC3 western blotting of primary LFs cultured with CSE-induced HBEC-derived EVs or non-treated HBEC-derived EVs in the presence or absence of protease inhibitors (E64d and pepstatin A). *P<0.05. **P<0.01. NC: negative control.
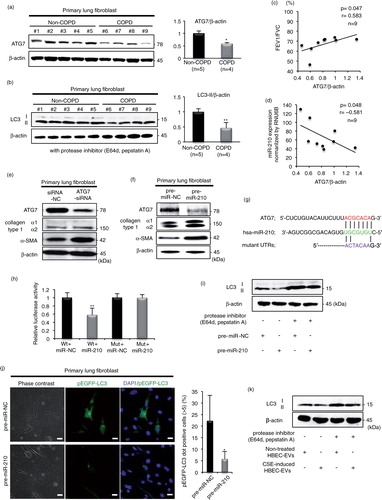
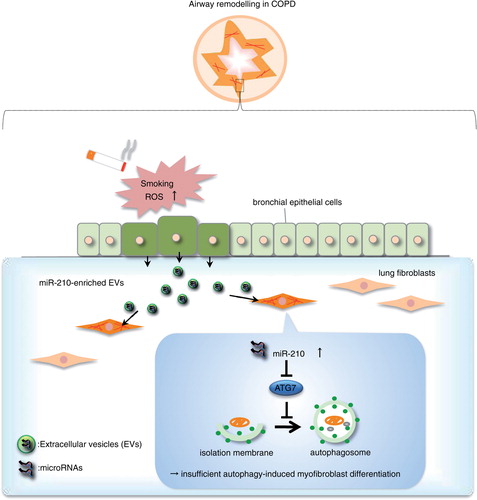
Fig. 5. Proposed novel airway remodelling model for bronchial epithelial cells and fibroblast crosstalk in COPD.