Figures & data
Fig. 1. Microparticles (MP) are gated on their size and ability to express phosphatidylserine when stained by Annexin V in the presence of calcium. Platelets (pink) show no expression of phosphatidylserine after staining by AV conjugated with APC, while MP (blue) show >95% positivity.
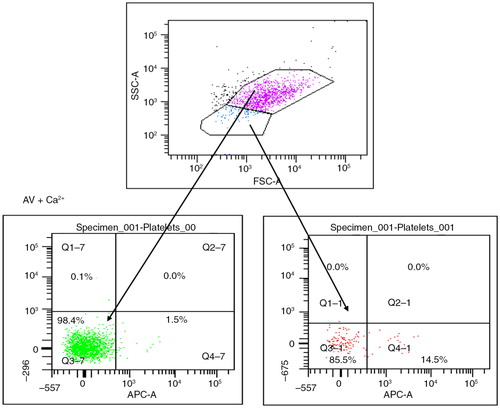
Fig. 2. Blood values (total Hb, HbS percentage Hct, MCV) in the different subgroups (control with HbAA, crises, steady state, HbSC, on treatment with hydroxyurea and transfusion).
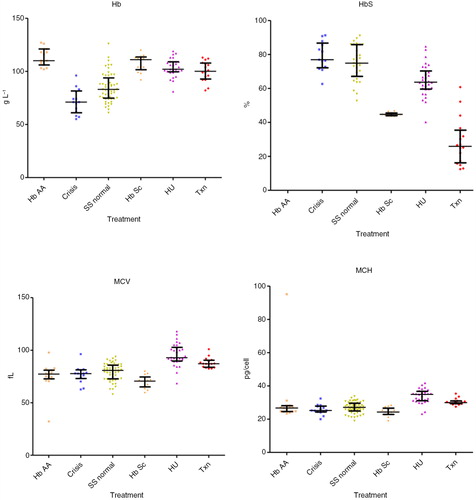
Fig. 3. Markers of hemolysis in all subgroups: reticulocytes, LDH and total-bilirubin.
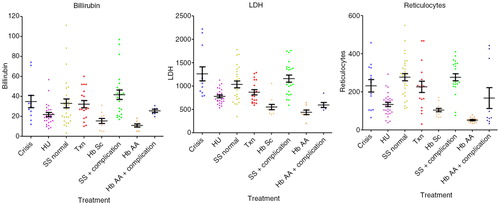
Fig. 4. Values of WCC, N and PLT in the different subgroups.
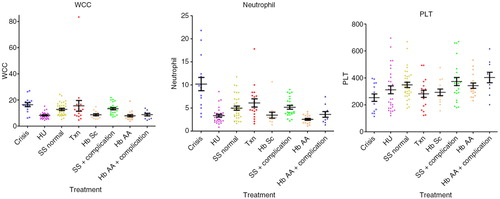
Table I. Hemoglobin levels, red cell indices, white cell count (WCC), platelet counts, bilirubin, lactate dehydrogenase (LDH) and reticulocyte counts
Fig. 5. MP numbers and percentages.
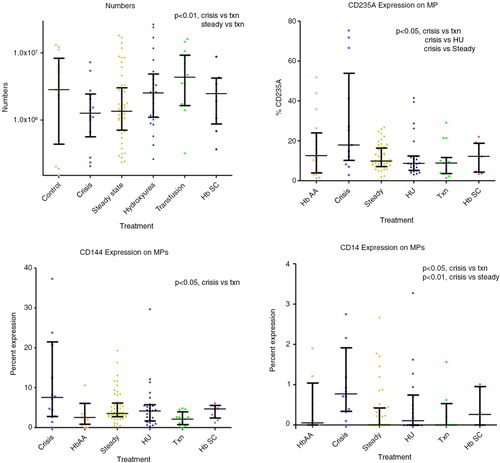
Fig. 6. ADM and ET-1, NO and ADM crises by type.
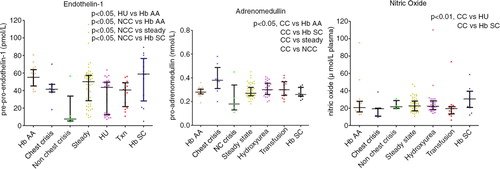
Fig. 7. NO, ET-1 and ADM subdivided by crises type (chest crises versus other).
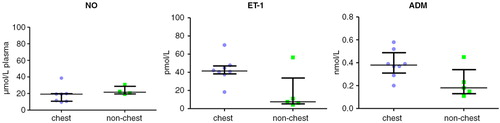
Table II. Statistical analysis of indicators of efficacy
Table III. Adrenomedullin (ADM), endothelin-1 (ET-1) and nitric oxide (NO) levels in SCA patients and controls
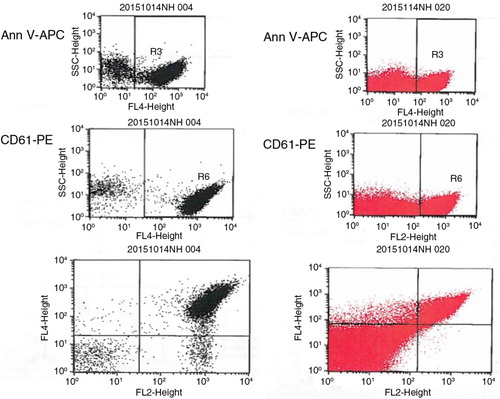
Fig. A1. From the top to the bottom: staining for AV, for CD61 and for AV & CD61 (PMP). Gating area using the methodology by Shet et al. (Citation16) (red, right) and this by Biró et al. (Citation23) (black, left). No clear demarcation is seen between MP and noise.