Figures & data
Fig. 1. Schistosoma mansoni excretes/secretes exosome-like extracellular vesicles (EVs) during in vitro cultivation. (a) Microscopic analysis of infective stage cercariae (scanning electron microscopy – left panel) and tissue-migrating schistosomulum (epifluorescent microscopy of fluorescein diacetate labelled parasites – right panel) demonstrates the excretion/secretion of micron-sized vesicles (highlighted by white rectangle boxes). To determine whether EVs were present in these (or other) excreted/secreted (E/S) products, we specifically examined the supernatant of 72 h in vitro cultivated schistosomula. (b) Parasite viability was assessed at 72 h using the helminth fluorescent bioassay (HFB) (Citation25) (n=11) in cultures containing or lacking foetal calf serum (FCS, a source of contaminating bovine EVs (Citation40)) compared to heat-killed controls. Error bars represent the standard deviation of the mean. Student's t-test was used to assess differences in viability between the schistosomula cultures. High content imaging (FITC and TRITC filters, 10×magnification) of fluorescently co-labelled schistosomula (fluorescein diacetate, green and propidium iodide, red) supports the HFB measurements. (c) EVs were isolated from E/S products by ultracentrifugation of the 72 h schistosomula culture supernatant (-FCS) and analysed by transmission electron microscopy at 30,000×magnification.
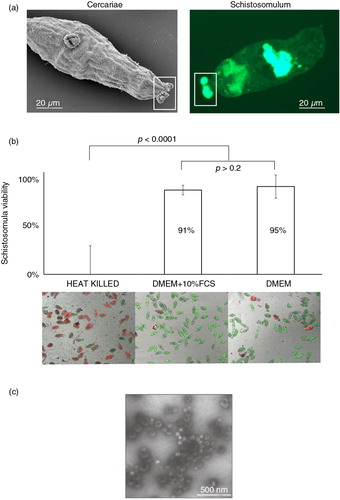
Table I. The top 35 protein hits in schistosomula EVsa
Fig. 2. Schistosomula EVs contain vesicular-enriched functional components and include proteins likely to be found in EVs derived from other schistosome lifecycle stages. EVs were isolated from 72 h schistosomula cultures using preparative ultracentrifugation (Citation23). Pelleted EVs (n=4) were digested with trypsin and subsequently prepared for liquid chromatography–tandem mass spectrometry. Only proteins represented by 1 or more unique peptides in 3 out of the 4 replicates (with 1 of these replicates having to contain at least 2 unique peptides) were considered as schistosomula EV proteins. (a) Bar chart representation of significantly enriched gene ontology (GO) categories found in EV proteomes analysed by g:Profiler (Citation45) using Benjamini–Hochberg false discovery rate detection and best per-parent GO identifier (moderate). (b) Expression profiling of the genes (derived from 102/109 Smps) encoding EV proteome components throughout the schistosome life cycle (Supplementary file 2). DNA microarray data (log2 normalized gene expression values) obtained from Fitzpatrick et al. (Citation26) was subjected to agglomerative hierarchical clustering (Euclidean distance and complete linkage) and illustrated as a heat map. The dashed rectangular box represents the 72 h schistosomula lifecycle stage.
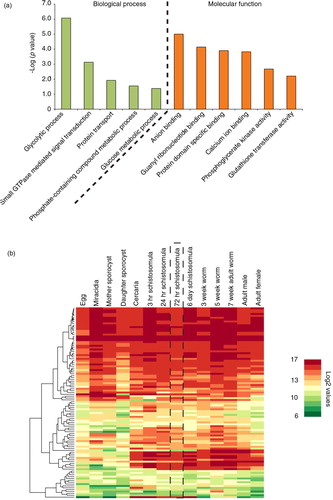
Fig. 3. Schistosomula excrete/secrete extracellular miRNAs. Supernatant from 72 h in vitro cultured schistosomula was separated into EV-enriched and EV-depleted fractions (n=3) by preparatory ultracentrifugation. Total RNA from each fraction was extracted using the miRNeasy kit (Qiagen) and prepared for RNA-seq using the NEBNext Small RNA (for Illumina HiSeq sequencing) kit. To identify sma-miRNAs in our samples, the miRDeep2 package was utilized (29). Only miRNAs with at least 10 reads in 2 out of the 3 biological replicates (in at least one of the fractions, EV-enriched OR EV-depleted) were considered in the study. A total of 205 putative sma-miRNAs passed this criterion. sma-miRNA read count data were normalized using the DESeq2 package (33) as described in the Materials and methods. (a) Heatmap depiction of sma-miRNA abundance (represented by Z-scores) found within EV-enriched and EV-depleted supernatant fractions after agglomerative hierarchical clustering and standardization. Each row represents a miRNA and its relative Z-score value in EV-enriched and EV-depleted fractions is displayed in the 2 columns. All sma-miRNA specifics (name, sequence, raw/normalized read counts and cluster location) are included in Supplementary file 3. (b) sma-miRNA localization found throughout the S. mansoni karyotype (v5.2). Vertical grey bars represent the position of known sma-miRNAs available in miRBase (v.21). Vertical black bars represent the localization of all extracellular sma-miRNAs (within EV-depleted and EV-enriched fractions) newly identified in our study. Black stars above the vertical lines represent 13 sma-miRNAs found in our study that are also present in miRBase. Eighteen miRNAs localized on unmapped scaffolds (16 not mapped at all; 1 unplaced on Ch 7, 4 and 3; 5 unplaced on Ch 1) as well as 15 miRNAs not yet mapped to the current S. mansoni genome assembly were not included in this analysis. All available sma-miRNA localization coordinates are available in Supplementary file 3.
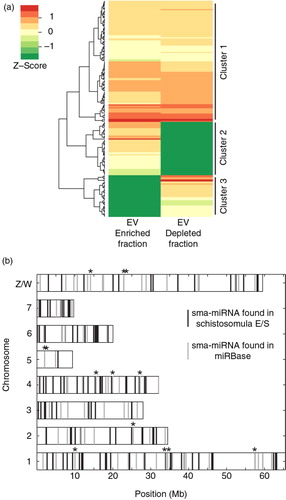
Table II. Small non-coding (snc) RNA-seq library statisticsa
Fig. 4. Most of the 35 known miRNAs released by schistosomula are found in comparable abundance between EV-enriched and EV-depleted fractions. Outputs from the miRDeep2.pl script within the miRDeep2 package were used to identify known platyhelminth miRNAs in schistosomula E/S samples. Manual curation against the recent literature (49,51,53) was also performed to identify previously described miRNAs that have not yet been uploaded to miRBase. A total of 35 known miRNAs were subsequently identified. (a) Known sma-miRNAs (26) found at similar abundance between EV-enriched (dark bars) and EV-depleted (light bars) fractions. (b) Known sma-miRNAs (9) found at a higher relative proportion in the EV-enriched (black bars) or the EV-depleted (grey bars) fraction (i.e. containing reads only in the EV-enriched or EV-depleted fractions after normalization). The asterisk (*) represents sma-miRNAs (sma-mir-76 and sma-mir-2149) identified by seed sequence similarity to Schmidtea mediterranea sme-miRNAs. Bar charts represent the miRNA log2 normalized read counts for each sample where the indicated sma-miRNA was found (see Materials and methods). Raw and processed sma-miRNA read data are found in Supplementary file 3.
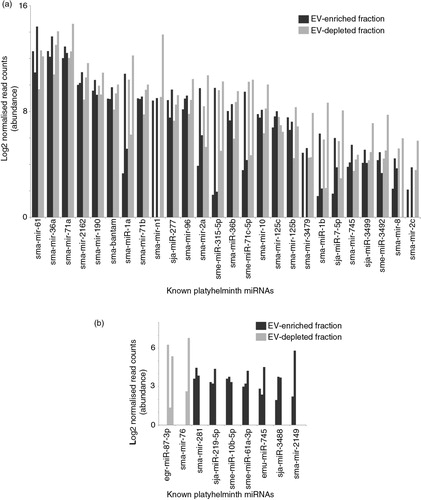
Fig. 5. Schistosomula E/S products contain large numbers of novel miRNAs found within and outside EVs. The miRDeep2 module was used to identify 170 potential novel sma-miRNAs found within schistosomula E/S products (see Materials and methods for details). (a) The 26 most abundant (out of 88 in total) novel sma-miRNAs found in both EV-enriched (black bars) and EV-depleted (grey bars) fractions. (b) The 26 most abundant miRNAs more likely to be found either in the EV-enriched (44 in total) or the EV-depleted (38 in total) E/S fractions (i.e. containing reads only in the EV-enriched or EV-depleted fractions after normalization). Bar charts represent the miRNA log2 normalized read counts for each sample where the indicated sma-miRNA was found (see Materials and methods). Raw and processed sma-miRNA read data are found in Supplementary file 3. Bold sma-miRNAs in (a) and (b) represent the most abundant miRNAs found in this study.
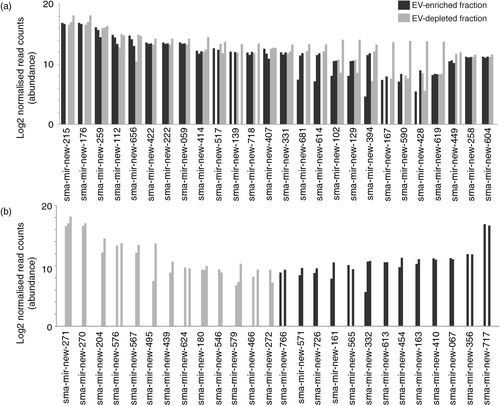
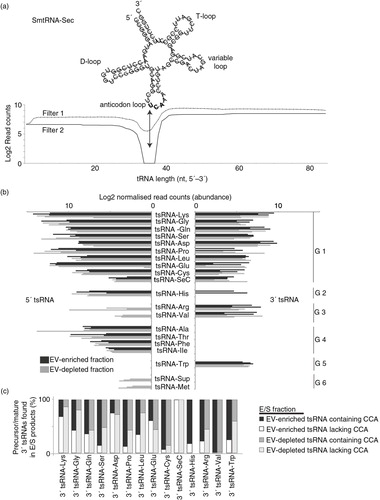
Fig. 6. Schistosomula release tRNA-derived small RNAs (tsRNA). Reads were mapped against the S. mansoni tRNA database depleted of mitochondrial and pseudo-tRNAs available from geneDB (34) and, using an in-house script, were characterized as 5′ or 3′ tsRNAs. (a) Secondary structure of smtRNA-SeC depicting characteristic cloverleaf shape composed of D-, anticodon, variable and T-loops. Below, the coverage of RNA-seq reads mapping to smtRNA-SeC (85 nucleotides) are quantified to give an example of how 5′ and 3′ tsRNAs were identified for all tsRNAs (using our processing criteria, no full-length tRNAs were identified in our study). Dashed and solid lines represent the reads mapping to smtRNA-SeC and illustrate the sequential steps (Filter 1 and Filter 2) employed by our in-house script as outlined in the Materials and methods. The arrow represents Position 35 (U in bold), which is the terminal nucleotide (initiating from the 5′ end) used to define 5′ tsRNAs (which happens to be in the anticodon loop for smtRNA-SeC). To define 3′ tsRNAs, a maximal length of 50 nt (also represented by the black arrow) initiating from the 3′ tRNA end was used. Clear read peaks can be visualized mapping to both 5′ and 3′ ends of tRNA-SeC. (b) Bar chart represents the tsRNAs (log2 normalized read counts) found in EV-enriched (black bars) or EV-depleted (grey bars) supernatant fractions. G1–G6 represent tsRNA groups displaying specific associations (see text for details). (c) Stacked histogram representation of 3′ tsRNAs derived from precursor tRNAs (lacking the 3′ CCA trinucleotide motif; white or light grey bars, EV-enriched and EV-depleted samples, respectively) or mature tRNAs (containing the 3′ CCA trinucleotide motif; black or dark grey bars, EV-enriched and EV-depleted samples, respectively).