Figures & data
Fig. 1. (Continued)
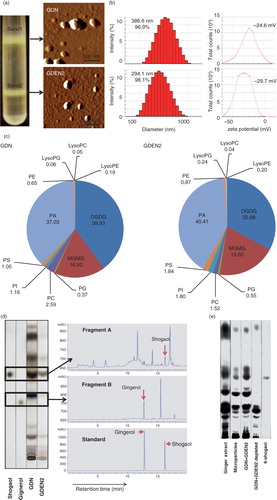
Fig. 1. Identification and characterization of ginger-derived nanoparticles (GDNs). (a) Two bands from sucrose-banded ginger rhizome root–derived samples were formed after gradient ultracentrifugation (left). GDN and GDEN2 particles were visualized by atomic force microscopy (AFM, right). (b) Size distribution (left) and surface zeta-potential (right) of the particles were determined using a Zetasizer Nano ZS. (c) Pie chart with a summary of the putative lipid species in GDN and GDEN2, reported as the percentage of total GDENs lipids. Major details are reported in Supplementary Table I. PA: phosphatidic acids; PS: phosphatidyl serine; PI: phosphatidyl inositol; PE: phosphatidyl ethanolamines; PC: phosphatidyl choline; PG: phosphatidyl glycerol; MG/DG: mono/di/glycerols. LysoPG: lysophosphatidyl glycerol; LysoPC: lysophosphatidyl choline; LysoPE: lysophosphatidyl ethanolamines. (d) TLCs (left) and HPLC (right) analysis of the lipid extracts from GDN and GDEN2. A standard shogaol (left panel, the 1st lane) or gingerol (left panel, the 2nd lane) were used as markers, (e) TLCs analysis of the lipid extracts from ginger extracts, ginger microparticles, pellet including GDN plus GDEN2, and ginger extracts with GDN and GDEN2 depleted, (f) GDN or GDEN2 was incubated in a stomach-like solution (top panel) for 60 min at 37°C and subsequently in small intestinal-like solution (bottom panel) for an additional 60 min at 37°C. Size distribution and surface zeta-potential changes were measured by Zetasizer Nano ZS. Results (a–f) represent at least 3 independent experiments.
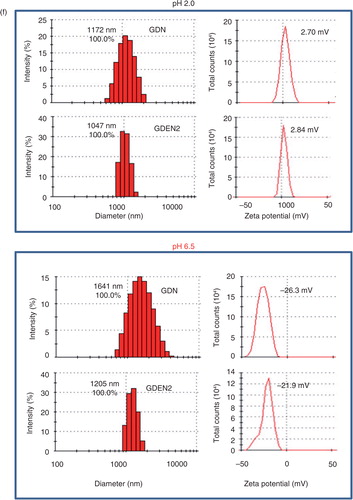
Fig. 2. (Continued)
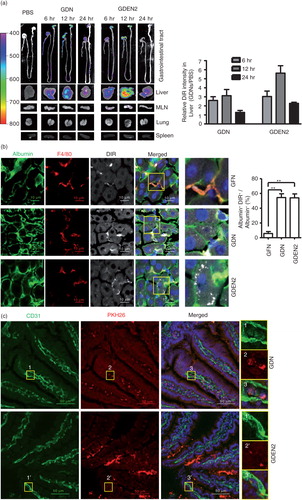
Fig. 2. In vivo distribution of orally administrated GDN and GDEN2. (a) In vivo imaging of trafficking of GDN. Male C57BL/6 mice were administered DiR dye labelled GDN (50 mg per mouse in 200 µL PBS) by gavage, and imaged over 24 h (left). The results are presented as mean of the net intensity (sum intensity/area, n=5) (right). (b) Hepatocytes taking up DIR labelled GDN. Male C57BL/6 mice were gavage administered DIR-GDN, DIR-GDEN2 or grapefruit nanoparticles (GFN) (50 mg per mouse in 200 µL PBS). Six hours after the administration, frozen sections of liver were examined by confocal microscopy for DIR+/Albumin+F4/80+ cells (left) and were quantified (right). Original magnification 40×. Confocal image analysis of frozen sections of intestines from mice fed PKH26+GDN or PKH26+GDEN2 after immunofluorescent staining for CD31 (c) or Lyve-1 (d) (green), original magnification 60× (left panel) with enlargement of indicated area shown in the right panel. Data are the mean±SEM of 3 experiments (a, b) or are representative of 3 experiments (c, d) (n=5 mice per group). (e) Blocking of primary hepatocyte uptake of PKH26-labelled GDN. Primary hepatocytes cells were incubated with the indicated chemical reagents or PBS as a control in the presence of PKH26-labelled PKH26+GDN or PKH26+GDEN2 (100 µg/mL) for 3 h. The treated cells were then washed, fixed, and cells were stained with anti-mouse albumin. PKH26+Albumin+ cells were examined using confocal microscopy and photographed. Results represent 1 out of 5 independent experiments.
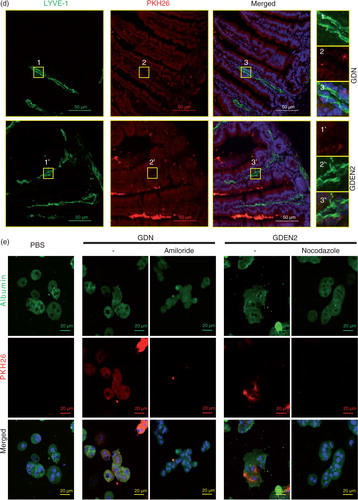
Fig. 3. (Continued)
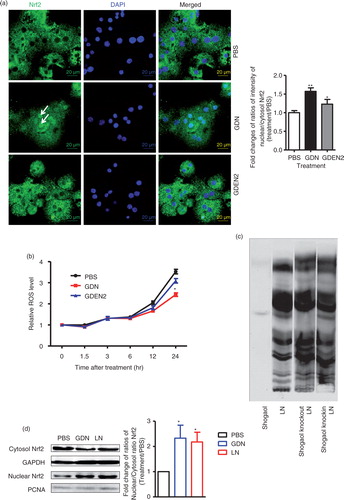
Fig. 3. TLF4/TRIF regulates GDN shogaol-mediated induction of nuclear translocation of Nrf2 in primary mouse hepatocytes. (a) Primary mouse hepatocytes from C57BL/6j mice were cultured in the presence of GDN or GDENs (100 µg/mL) for 4 h. Cells were then fixed and stained with anti-Nrf2 antibody. Nrf2+ cells were examined using confocal microscopy (left) and were quantified (right). Original magnification was 40×. An example of Nrf2 translocated from the cytoplasm to the nucleus is indicated by white arrows. The data (right panel) were expressed as fold changes of ratios of the intensity of nuclear to cytoplasmic signal of Nrf2 in cells. The results represent the mean±SEM of 3 independent experiments (right). *p<0.05 (Student's t-test). (b) Primary mouse hepatocytes from C57BL/6j mice were cultured for 24 h in the presence of GDN or GDENs (100 µg/mL). The induction of ROS at different time points as indicated in b was measured. Data are the mean±SEM of 5 experiments. *p<0.05 (Student's t-test). (c) The lipids extracted from GDN-derived liposome-like nanoparticles (LN) or LN with shogaol knock-out or knock-in and a standard shogaol were separated on a thin-layer chromatography plate and developed. A representative image was scanned using an Odyssey Scanner. (d) Primary mouse hepatocytes were cultured for 4 h in the presence of GDN (d, 100 µg/mL) or LN from GDN (100 µg/mL) with shogaol knock-out or knock-in (e). Cytoplasmic and nuclear extracts were isolated, subjected to western blotting and probed with anti-Nrf2 antibody, or GAPDH or PCNA antibodies as controls. Results (c–e) represent one of 3 independent experiments. *p<0.05, **p<0.01 (Student's t-test). (f) Primary mouse hepatocytes were cultured for 4 h in the presence of LN or LN derived from GDN (100 µg/mL) with shogaol knock-out or knock-in (shogaol, 3.18 µM). The induction of DCF in the treated cells was FACS analysed. Results (f) represent one of 3 independent experiments. The data (right panels, d–e) were expressed as fold changes of ratios of the intensity of nuclear to cytoplasmic of Nrf2 in cells. The results represent the mean±SEM of 3 independent experiments. (g) Primary mouse hepatocytes from TLR4, TRIF and MyD88 knock-out mice were cultured for 4 h in the presence of GDN (100 µg/mL) or LN from GDN (100 µg/mL) or LN with shogaol knock-out or knock-in (shogaol, 3.18 µM). Cytoplasmic and nuclear extracts were isolated, subjected to western blotting and probed with anti-Nrf2 antibody; GAPDH or PCNA antibodies served as controls. Results represent one of 3 independent experiments (n=3). The data (bottom panels) were expressed as fold changes of ratios of the intensity of nuclear to cytoplasmic signal of Nrf2 in cells. *p<0.05 (Student's t-test).
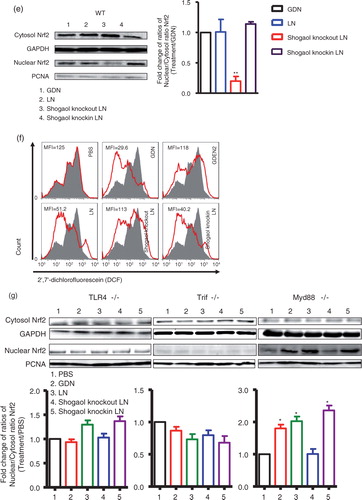
Fig. 4. (Continued)
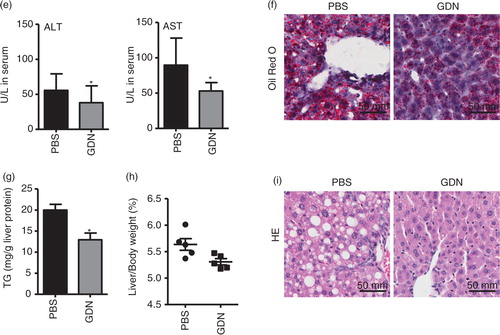
Fig. 4. Oral administration of GDN protects alcohol-induced liver injury. (a) Real-time analysis of expression of different genes at 6 h in the livers of C57BL/6j male mice orally administered with GDN (50 mg in 200 µL PBS). The results represent the mean±SEM of 3 independent experiments. *p<0.05 (Student's t-test). (b) Male C57BL/6 mice were intravenously (b, 1st panel from left, 10 µg/mouse) or orally administered (b, 2nd and 3rd panels, 250 µg per mouse in 200 µL PBS) with IRDye-700DX covalent-conjugated GDN, and plasma were collected over 360 min, and scanned with a Li-CoR Scanner. Amount of GDN in plasma was calculated based on the standard curve made from IRDye-700DX labelled GDN (b, right panel). The results are presented as the mean of net intensity (sum intensity/area, n=5). (c) Quantification of GDN in the plasma. Male C57BL/6 mice were orally administered (250 µg per mouse in 200 µL PBS) IRDye-700DX covalent conjugated and DIR dye labelled GDN or PBS as a control. Plasma was collected 45 min after oral administration and diluted in PBS at 1:10 for ultracentrifugation at 150,000g for 2 h. The pellets were resuspended in PBS and scanned with a Li-CoR Scanner. Representative images are shown (left panel). Fold changes of intensity of fluorescent signal of GDN versus PBS-fed mice were calculated. Data (right panel) are the mean±SEM of 3 experiments (n=5). (d) Male C57BL/6 mice were fed with either regular diet (top and middle panels) or a liquid diet containing 5% ethanol daily (bottom panel) for 7 days. Mice fed with regular diet or ethanol diet were orally administered IRDye-700DX covalent conjugated and PKH67 double labelled GDN (250 µg per mouse in 200 µL PBS). Twelve hours after the administration, frozen sections of liver were examined by confocal microscopy for PKH67+/IRDye-700DX+ cells. Original magnification is 40× (first 4 columns from left) with enlargement of indicated area shown in the last columns. (e–i) Eight-week-old male C57BL/6j mice fed a liquid diet containing 5% ethanol daily for 7 days. Starting on day 7, mice were gavage-administered GDN (50 mg/day) or PBS as a control daily while continuing the feeding of the 5% ethanol diet until day 14. On day 14, mice were fed with 30% instead of 5% ethanol and gavaged with a last dose of GDN at 9 h post-ethanol administration. The mice were euthanized and assessed (n=5 mice per group) for (e) levels of ALT and AST in serum, (f) neutral triglycerides and lipids using Oil red stain, (g) liver triglyceride (TG), (h) ratios of liver/body weight and (i) H&E-stained sections of livers from mice pretreated with PBS or GDN. Original magnification 20×. Data (e, g–h) are the mean±SEM of 3 experiments (n=5). *p<0.05 (Student's t-test). Results (f, i) represent one of 3 independent experiments.