Figures & data
Fig. 1. Procedures employed for the production, fractionation and characterization of T. cruzi EVs from different strains.
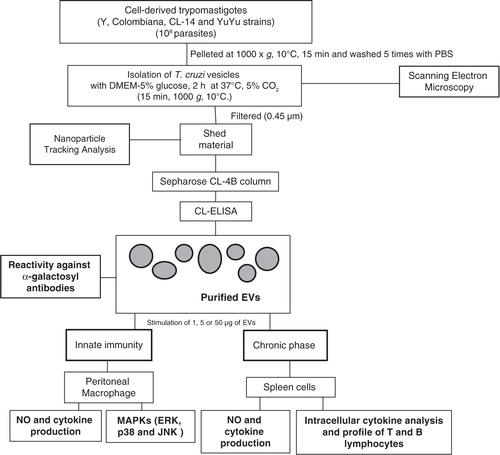
Fig. 2. Flow cytometry strategy for intracellular cytokine production by spleen cells from infected mice. (a) Dot plots of CD4, CD8, CD19, F4/80/CD11b and MHCII/CD11c expression. The representative dot plots illustrating the frequency (%) of cytokines from spleen cells are shown for Colombiana and YuYu strains. (b) CD4+IL-10+ cells. (c) CD8+IL-10+. (d) CD19+TNF-α+. (e) MHC/CD11c+TNF-α+.
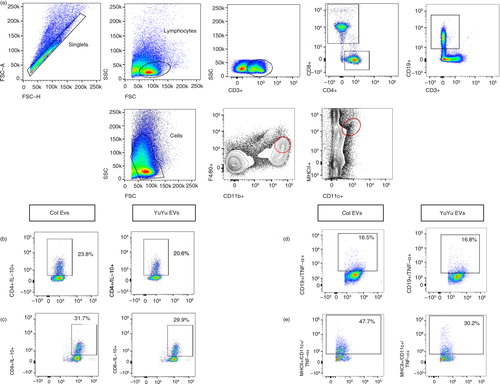
Fig. 3. Trypanosoma cruzi (Y strain) trypomastigotes spontaneously shed vesicles from their entire membrane surface. Scanning electron microscopy (SEM) of parasite membrane shedding after incubation in culture medium (a–d, bars: 1–5 µm). Magnification: (a) 27,383×, (b) 25,242×, (c) 60,470× and (d) 92,084×.
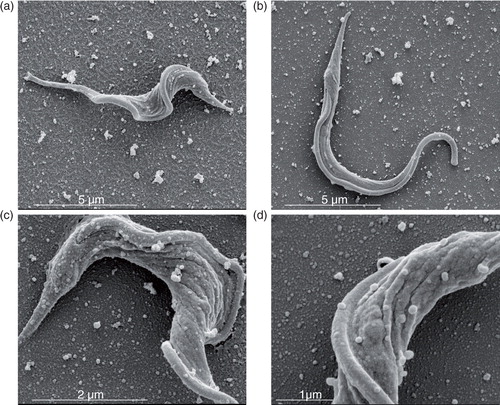
Fig. 4. Nanoparticle tracking analysis of the EVs isolated from different strains of T. cruzi. Graphic demonstration of size distribution and concentration for Y (a), Colombiana (b), CL-14 (c) and YuYu (d) strains. The average size (nm) (e) and concentration (particles/mL) (f) of the vesicles for all strains are represented. Data are representative of 3 independent experiments.
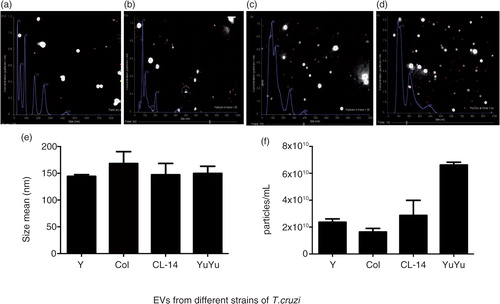
Fig. 5. Protein and terminal α-galactosyl residues measurement in EVs isolated from 4 T. cruzi strains. (a) Protein concentration in EV-pooled (b) EVs reactivity with anti-α-Gal antibodies (1:500) determined by ELISA. Negative control corresponds to the medium with 5% glucose without EVs. Bars express the mean value±SD of 4 separate studies (*p < 0.05).
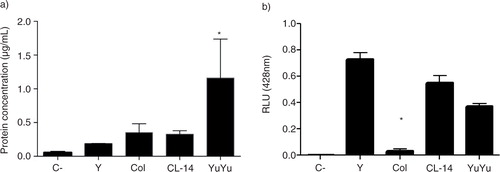
Fig. 6. Nitric oxide (NO) production by murine macrophages stimulated by EVs from CL-14 and YuYu strains is dependent on TLR2. Murine macrophages (C57BL/6, TLR2 − /− and TLR4 − /−) were stimulated with different concentrations of T. cruzi EVs (1, 5 and 50 µg). Cells were pre-incubated with IFN-γ (100 U/mL) for 18 h prior to addition of EVs or LPS, LPG and live parasites MOI 10:1 (positive controls). Negative controls included medium and medium + INF-γ. LPG Lb, L. braziliensis LPG; LPS, lipopolysaccharide (LPS) from E. coli; T. cruzi (Y), live parasites of T. cruzi (Y strain). Bars express the mean value±SD of 2 separate studies (*p < 0.05).
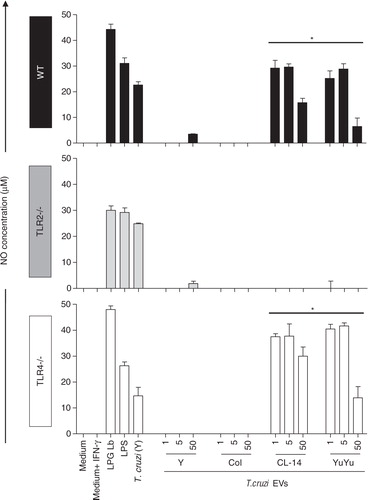
Fig. 7. TNF-α production by murine macrophages stimulated by EVs from CL-14 and YuYu strains is dependent on TLR2. Murine macrophages (C57BL/6, TLR2 − /− and TLR4 − /−) were stimulated with different concentrations of T. cruzi EVs (1, 5 and 50 µg). Cells were pre-incubated with IFN-γ (100 U/mL) for 18 h prior to addition of the EVs, and controls (LPS, LPG and live parasites MOI 10:1) (positive controls). Negative controls included medium and medium + INF-γ. IFN-γ, gamma-interferon; LPG Lb, L. braziliensis LPG; LPS, lipopolysaccharide from E. coli; T. cruzi (Y), live parasites of T. cruzi (Y strain). Bars express the mean value±SD of 2 separate studies (*p < 0.05).
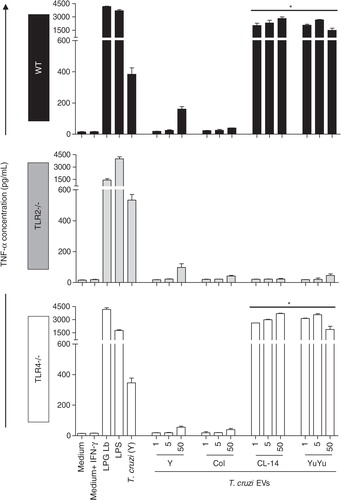
Fig. 8. Trypanosoma cruzi EVs equally activate MAPKs (ERK 1/2, p38 and JNK) from J774.1 macrophages. Cells were stimulated with EVs (5 µg/mL) at different time points (5, 15, 30 and 45 min). Dually phosphorylated MAPKs were detected by western blot: (a) ERK 1/2, (b) p38 and (c) JNK. C-, negative control (medium); C+, positive control (LPS from E. coli) (100 ng/mL).
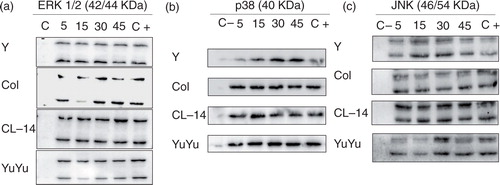
Fig. 9. Trypanosoma cruzi EVs from Colombiana and Y strains display a higher pro-inflammatory activity in splenocytes derived from chronically infected mice. Cells were incubated with EVs (5 µg/mL) or total T. cruzi antigen (10 µg/mL) (positive control). Spleen cells from non-infected mice with and without the addition of a new stimulus were also used as controls. TNF-α (a) and IFN-γ (b) concentrations (pg/mL) were determined by CBA. Medium, negative control; TcAg, soluble trypomastigote antigen of T. cruzi; Bars express the mean value±SD of 2 separate studies (*p<0.05).
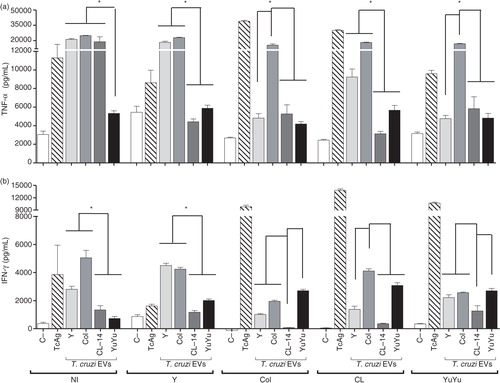
Fig. 10. Trypanosoma cruzi EVs from Colombiana and Y strains display differential immunomodulatory activity in splenocytes derived from chronically infected mice. Cells were incubated with EVs (5 µg/mL) or total T. cruzi antigen (10 µg/mL) (positive control). Spleen cells from non-infected mice with and without the addition of a new stimulus were also used as controls. IL-6 (a) and IL-10 (b) concentrations (pg/mL) were determined by CBA. Medium, negative control; TcAg, soluble trypomastigote antigen of T. cruzi; bars express the mean value±SD of 2 separate studies (*p<0.05).
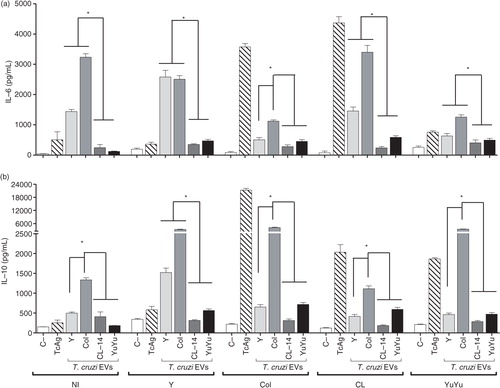
Fig. 11. Intracellular cytokine production by T lymphocytes is similar after stimulation with EVs from Colombiana or YuYu strains. (a) CD4+ production of intracytoplasmic cytokines (IL-10 with IFN-γ and TNF-α). (b) CD8+ production of intracytoplasmic cytokines (IL-10 with IFN-γ and TNF-α). Immunophenotypic staining was performed as described in the Material and Methods section. Bars express the mean value±SD of 2 separate studies (*p<0.05).
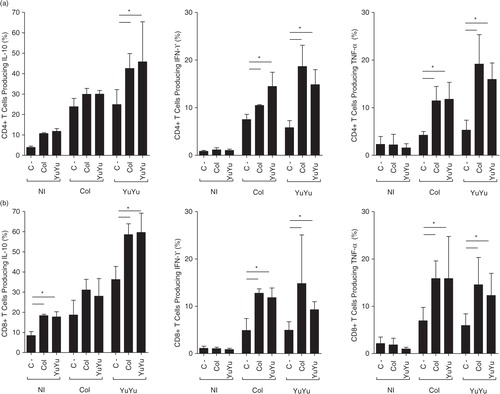
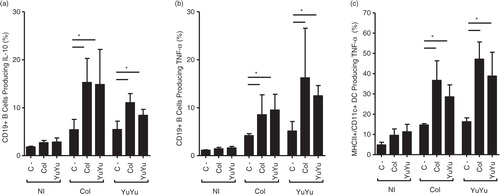
Fig. 12. Intracellular cytokine production by B and DC is similar after stimulation with EVs from Colombiana or YuYu strains. (a) CD19+IL-10+ production. (b) CD19+TNF-α+production. (c) MHCII/CD11c+TNF-α+ production. Immunophenotypic staining was performed as described in the Material and Methods section. Bars express the mean value±SD of 2 separate studies (*p<0.05).