Figures & data
Fig. 1. Measurements of cell-free supernatants containing erythrocyte and platelet EVs. Concentration of erythrocyte EVs (a) and platelet EVs (b) in cell-depleted supernatants (starting materials) were measured by RPS, NTA and FCM using antibodies CD235a and CD61 respectively. Particle size distribution indicated by minimum, mode and maximum particle diameter (nm) detected by RPS and NTA in both cell-free supernatants containing erythrocyte EVs (c) and platelet EVs (d) are presented.
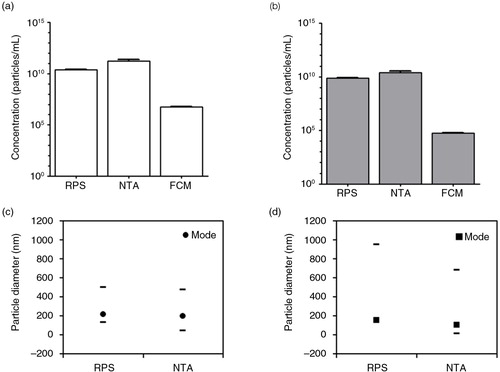
Fig. 2. Effect of centrifugation on erythrocyte EVs. Cell-depleted supernatant containing erythrocyte EVs (starting material) was centrifuged using different centrifugal force and time. On the x-axis of graphs a–e and i, the centrifugal force (× g) and time (hour, h) are indicated. Isolated erythrocyte EVs were reconstituted in PBS and measured immediately by RPS (a), NTA (b) and FCM using antibody CD235a (c). Percentage of recovery indicated on the y-axis of graphs a–c was calculated by comparing concentrations measured from erythrocyte EVs prepared by different centrifugation conditions with those measured from the starting material. Error bars represented measurement uncertainties estimated with each applied technique as presented in Supplementary Table S2. Particle size distribution indicated by minimum, mode and maximum particle diameter (nm) detected by RPS (d) and NTA (e) in both starting material and isolated erythrocyte EVs samples are presented. All results shown in a–e were from single measurements. Representative TEM images of erythrocyte EVs in the starting material (f), centrifuged at 18,890×g for 0.5 hour (g) and at 100,000×g for 2 hours (h) are shown. Scale bars of all TEM images are 500 nm. Graph showing results of TSEM measurement of the diameter of erythrocyte EVs in the fresh starting material and in the fresh isolated erythrocyte EVs samples is presented (i).
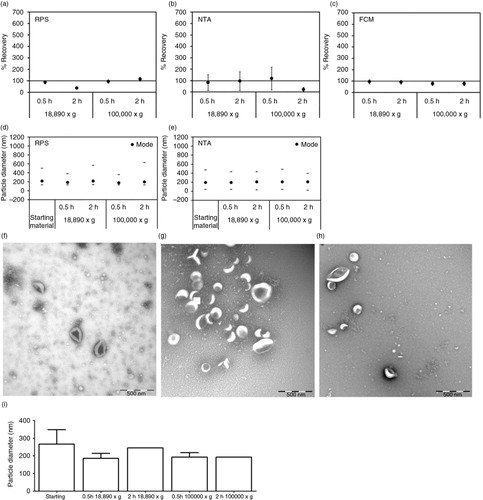
Fig. 3. Effect of centrifugation on platelet EVs. Cell-depleted supernatant containing platelet EVs (starting material) was centrifuged using different centrifugal force and time. On the x-axis of graphs a–e, the centrifugal force (x g) and time (hour, h) are indicated. Isolated platelet EVs were reconstituted in PBS and measured immediately by RPS (a), NTA (b) and FCM using antibody CD61 (c). Percentage of recovery indicated on the y-axis of graphs a–c was calculated by comparing concentrations measured from platelet EVs prepared by different centrifugation conditions with those measured from the starting material. Error bars represented measurement uncertainties estimated with each applied technique as presented in Supplementary Table S2. Particle size distribution indicated by minimum, mode and maximum particle diameter (nm) detected by RPS (d) and NTA (e) in both starting material and isolated platelet EVs samples are presented. All results shown in a–e were from single measurements. Representative of TEM images of platelet EVs in the starting material (f), centrifuged at 18,890×g for 0.5 hour (g) and at 100,000×g for 2 hours (h) are shown. Scale bars of all TEM images are 500 nm.
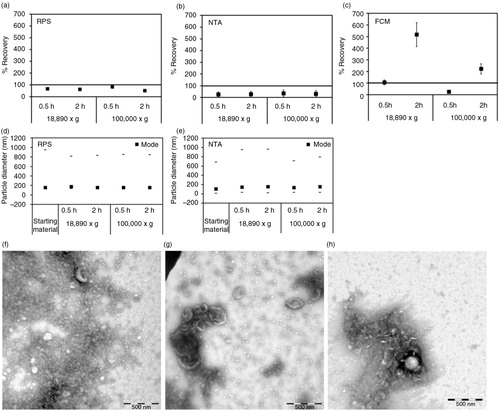
Fig. 4. Effect of a single freeze–thaw cycle on erythrocyte and platelet EVs. Starting materials containing erythrocyte and platelet EVs were measured directly after preparation and after a single freeze–thaw cycle. Starting materials were frozen at different temperatures (−20, −80 or −196°C). Concentration measurements in the erythrocyte EVs were done by RPS, NTA and FCM using antibody CD235a (a). Also, concentration measurements in the platelet EVs were done by RPS, NTA and FCM using antibody CD61 (b). The particle mode diameter of erythrocyte EVs (c) and platelet EVs (d) were measured by RPS and NTA. All results presented were from a single measurement. Error bars represented measurement uncertainties estimated from the applied techniques as presented in Supplementary Table S2. Representative TEM images of erythrocyte EVs (e) and platelet EVs (f) after frozen at −196°C, storage at −80°C and thawing on ice are presented. Scale bars are 500 nm.

Fig. 5. Effect of centrifugation on plasma EVs. Plasma was centrifuged at 18,890×g for 2 hours and the pellet was resuspended and analysed using TEM (a, b). To reduce background due to plasma proteins, the same plasma was diluted 8-fold prior to centrifugation using the same condition (c, d).
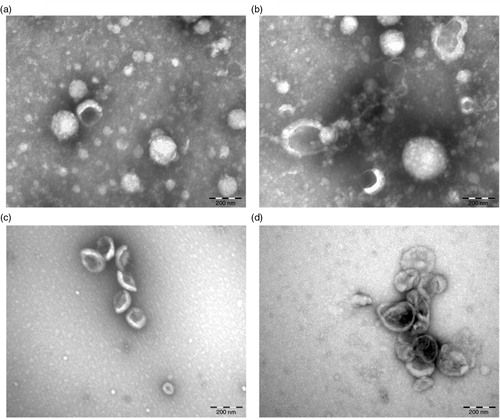
Fig. 6. Effect of time delay between blood collection and plasma preparation on erythrocyte and platelet EVs. Blood samples collected from fasted and healthy individuals (n=5) were centrifuged after 5 minutes (min) and 1 hour (h) of the blood collection. Particle concentration and particle mode diameter (nm) of EVs in plasma were measured by RPS (a, c) and NTA (b, d). Measurement of EVs by FCM used antibody CD235a, antibody CD61 and lactadherin (e).
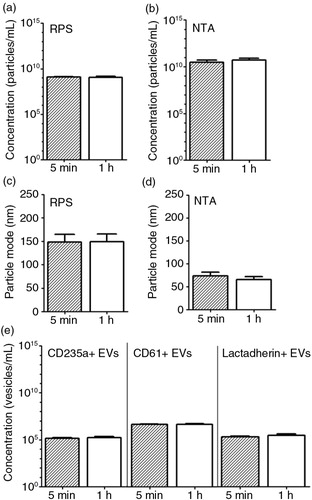
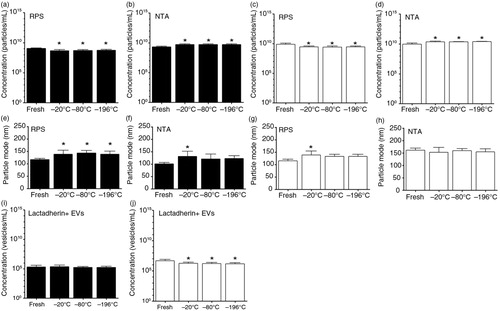
Fig. 7. Effect of a single freeze–thaw cycle and storage duration of plasma on erythrocyte and platelet EVs. EVs were measured in fresh plasma (white bars) and in plasma frozen at −20, −80 or −196°C, and stored at −80°C for 6 months (dark grey bars) and 1 year (black bars). Particle concentrations in these samples have been measured by using RPS (a) and NTA (b). RPS and NTA were used to determine the particle mode diameter (nm) of EVs in fresh and stored plasma samples (c and d, respectively). Concentrations of erythrocyte EVs (CD235a+ EVs), platelet EVs (CD61+ EVs) and phosphatidylserine-exposing EVs (lactadherin+ EVs) measured by FCM are shown (e). The asterisk (*) indicates the number of lactadherin+ EVs in the stored plasma is significantly higher than in the fresh plasma (p<0.05).
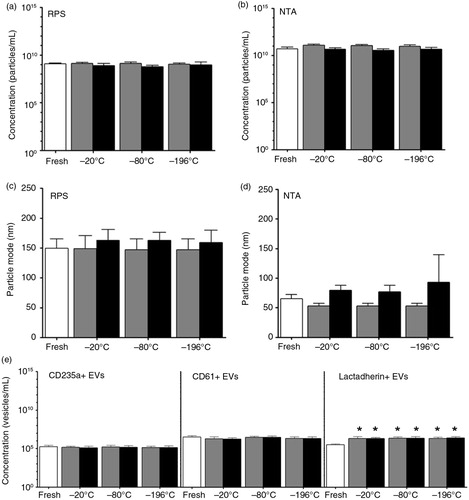
Fig. 8. Effect of a single freeze–thaw cycle and storage duration of EVs in urine and saliva. Urine and saliva were collected from fasted and healthy individuals (n=5). EVs in fresh urine and in urine frozen at −20, −80 or −196°C and stored for 1 year at −80°C, were measured by RPS (a) and NTA (b). Similarly, EVs in fresh saliva and in saliva frozen at −20, −80 or −196°C and stored for 1 year at −80°C were measured by RPS (c) and NTA (d). The particle mode diameter (nm) of urinary EVs was determined by RPS (e) and NTA (f). Also, in saliva samples the particle mode diameter (nm) was determined by RPS (g) and NTA (h). Concentrations of lactadherin+ EVs in urine (i) and in saliva (j) samples were measured by FCM. The asterisk (*) indicates that the conditions of a single freeze–thaw cycle and storage duration have significant effects on EVs compared to the fresh condition (p<0.05).