
Figures & data
Fig. 1. Flow cytometry of microvesicles. (a) MV size gate setup with fluorescent beads; a representative cytograms of PMVs, AVMVs, EMVs, TFMVs, LMVs, RMVs of (b) healthy donor and (c) trauma patient.
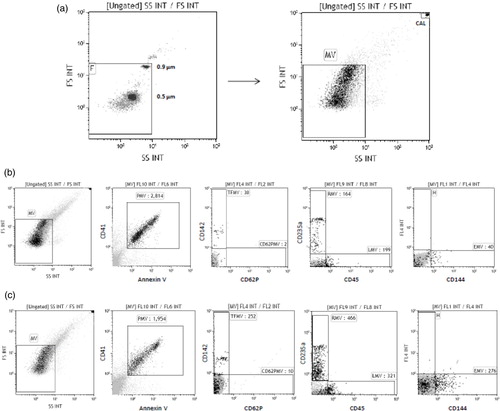
Table I. Trauma patients characteristics (n=169)
Table II. MVs in controls and injured patients
Fig. 2. Admission TFMV, AVMV, and LMV levels and total blood products transfused within the first 24 h. Differences in blood product transfusion by (a) TFMV, (b) AVMP, and (c) LMV level quartiles were determined by the Kruskal–Wallis test. (a) *Denotes p < 0.0001 compared to Q1; (b) *Denotes p < 0.005 compared to Q1; (c) *Denotes p < 0.05 compared to Q1;**Denotes p < 0.001 compared to Q1.
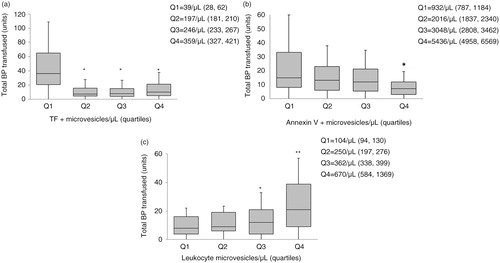
Fig. 3. Admission MV levels in trauma patients, survivors versus non-survivors. Box plots depict differences in MV levels for each cell of origin between patients who were alive versus non-survivors 24 h after admission. *Denotes p<0.005 compared to alive.
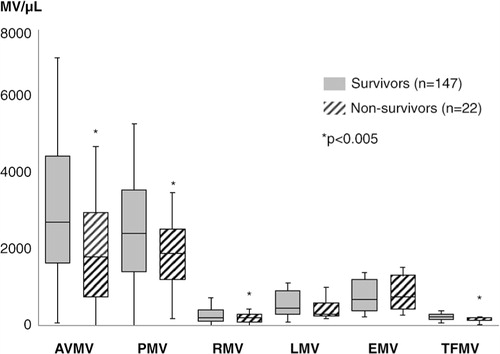
Fig. 4. PMV and AVMV levels in trauma patients at the ER and ICU admission, survivors versus non-survivors. Blood was collected on a subset of enrolled patients upon admission to the ICU. Box plots depict differences in (a) AVMV and (b) PMV levels upon admission to the ER versus ICU between patients who were alive or did not survive 24 h after initial admission. (a) *Denotes p=0.00004 comparing AVMV levels in the ICU between survivors and non-survivors; (b) *Denotes p=0.003 comparing PMV levels in the ICU between survivors and non-survivors.
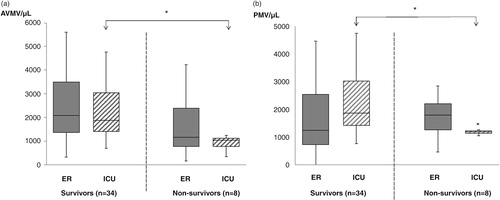
Table III. Demographics of injured patients with blood sample collected at ED and ICU (n=42)