Figures & data
Fig. 1. A schematic diagram of iSRAP workflow. The analysis steps involve pre-processing (sequence trimming and alignment), alignment and data quality check, and differential expression profiling. Input files are either BAM alignment or raw FASTQ sequencing data. iSRAP will determine the analysis steps required for raw sequence or alignment files. Different types of tabular and graphical outputs are generated automatically in iSRAP. The solid arrow represents the flow of the analysis. The computational tasks and analysis tools are, respectively, underlined and bolded.
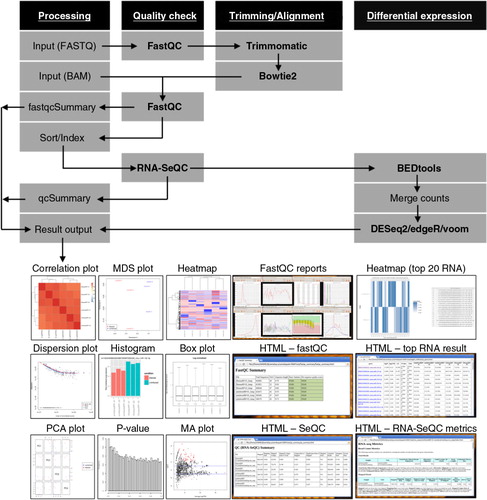
Table I. Description of tasks in iSRAP
Fig. 2. Illustration of result outputs from iSRAP using Huntington's disease data set. (a) Boxplot depicting the read counts normalization. The y-axis shows the normalized log2 counts per million values of miRNA in each sample. (b) Dispersion plot estimates the biological variation showing the gene-wise estimates (black), the fitted values (red) and the final maximum posteriori estimates (blue). (c) The p-value distribution plot shows the frequency of differentially expressed miRNA against the p-values obtained from DESeq2 analysis. The observed distribution shows a peak at near 0. (d) The MA plot shows the log2 fold-changes between disease and healthy individuals over the mean of normalized counts. Each dot represents individual miRNA. The red line at y=0 indicates no expression changes between the conditions. The red dots on the plot represent miRNAs that have significant expression changes. (e) Heatmap of unsupervised hierarchical clustering of miRNA profiles across all samples. The degree of low to high miRNA expression is represented from blue to red. (f) Bar plot showing one of the top differentially expressed miRNAs (miR-196a-5p). The pink and green bars indicate the respective control and disease samples. (g) Heat map showing the 20 most significant differentially expression miRNAs between disease and healthy individuals. The ranking table details the chromosome, start and end of chromosome, and followed by the miRBase accession number of each miRNA. The shade of blue indicates degree of down- and up-regulated miRNAs in the disease state.
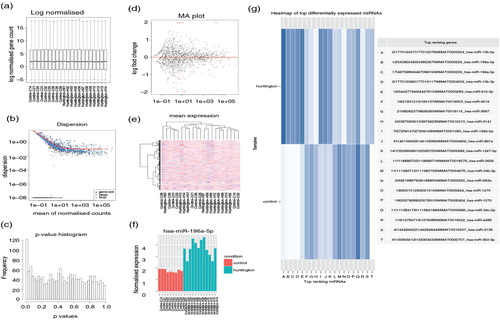
Fig. 3. Heatmap of unsupervised hierarchical clustering and correlation matrix of neuronal-derived exosome and GT1-7 neuronal cell samples. Heatmap of expression level of microRNAs (a) and other small RNAs (b), including transfer RNA, piwi-interacting RNA, ribosomal RNA, small nucleolar RNA and small nuclear RNA. (c) Distance mapping of small RNA expression using Euclidean distance metric of OptiPrep™ exosomes, ultracentrifugation exosomes and GT1-7 neuronal cells. Exosomes prepared by both methods are closely related to each other, but distantly related to neuronal cells. Abbreviations: “GTcell” denotes GT1-7 mouse neuronal cell line; “OPexo” refers to exosomes isolated from OptiPrep™ velocity gradient ultracentrifugation; “UCexo” refers to exosomes isolated from differential ultracentrifugation; “RP” denotes sample replicate.
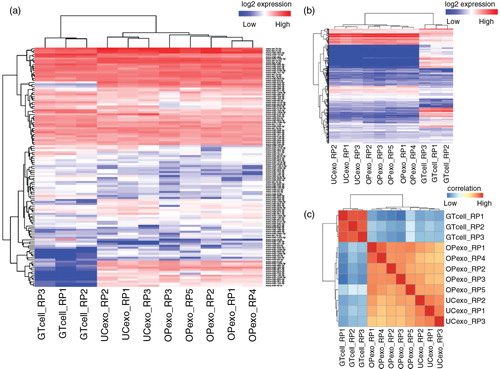
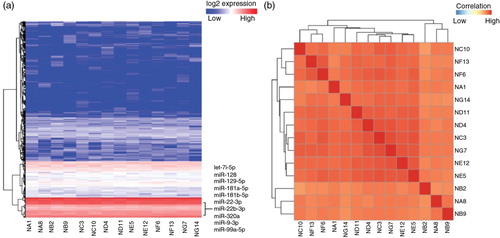
Fig. 4. Heatmap of unsupervised hierarchical clustering and correlation matrix of human plasma-derived exosomes. (a) Heatmap of small RNA profiles including microRNA, transfer RNA, piwi-interacting RNA, ribosomal RNA, small nucleolar RNA and small nuclear RNA. (b) Distance mapping of small RNA expression using Euclidean distance metric of all replicates from 7 human individuals, generating a total size of 14 samples.