
Figures & data
Fig. 1. Cryo-electron microscopy image of a pure, unprocessed PFP sample. A single EV is observed (arrow), self-supported in a nanodroplet of frozen PFP (black asterisk), suspended on a perforated carbon net (white asterisk). Scale bar: 1 µm.
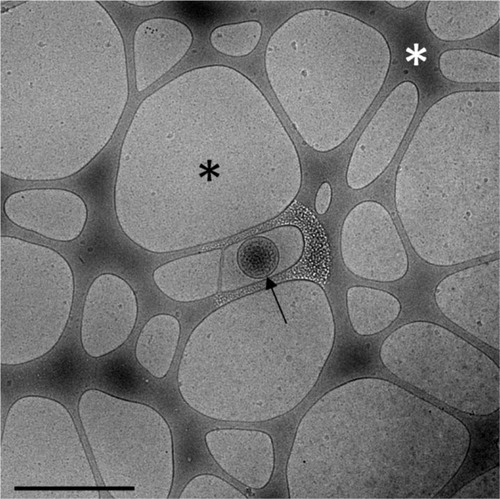
Fig. 2. Representative cryo-electron microscopy images of EV aggregates in 100k-PFP samples. (a, d–g), double labelling with 10 nm anti-CD41-gold-NPs and 4 nm Anx5-gold-NPs; (b, c), double labelling with 10 nm anti-CD235a-gold-NPs and 4 nm Anx5-gold-NPs. In (a), several A5−/CD41+ EVs and A5−/CD41− EVs are indicated, associated with some amorphous material (white asterisk). (b), Aggregate associating several 10s of EVs, including several A5−/CD235a+ EVs. (c), High magnification view of the dashed box from (b), allowing one to distinguish between A5+/CD235a− EVs and A5−/CD235a− EVs. One Anx5-gold-NP is circled in red. The white asterisk points to amorphous material. (e–g), High magnification views of the EVs from (d) labelled +/+ (for A5+/CD41+), +/− (for A5+/CD41−) and −/− (for A5−/CD41−), respectively. One Anx5-gold-NP is circled in red in (e) and (f). For the sake of clarity, the carbon net has been overlaid in turquoise in (a, b, d). Scale bars: a, b, d: 500 nm; c, e–g: 100 nm.
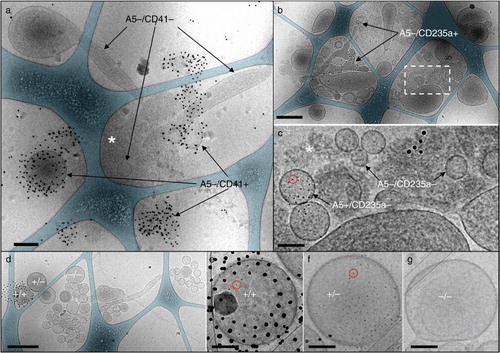
Fig. 3. Representative images of EVs from (a) PFP and (b, c) 100k-PFP sedimented onto electron microscopy grids after Anx5-gold labelling. (a) Isolated Anx5-positive EVs are observed, with no EV aggregates. (b) An EV aggregate, about 800 nm in overall size, is observed, together with isolated EVs (arrows). (c) High magnification view of the dashed box from b; the EV aggregate contains Anx5-positive and Anx5-negative EVs. Scale bars: 500 nm.
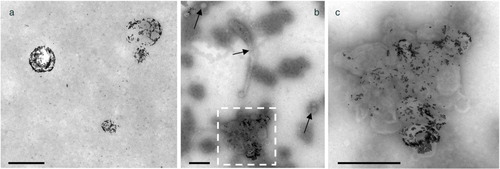
Fig. 4. Flow cytometry analysis of a PFP (left column) and the corresponding 100k-PFP (right column) after double labelling with Anx5−Cy5/CD41−PE (a, b) or Anx5−Cy5/CD235a−PE (c, d). EV concentrations (expressed as EV/µL sample) are indicated for each EV population. Colour code for the dot plots: Anx5+/CD41− or Anx5+/CD235a−, blue; Anx5−/CD41+, green; Anx5+/CD41+, orange; Anx5−/CD235a+, red; Anx5+/CD235a+, purple; background noise, grey.
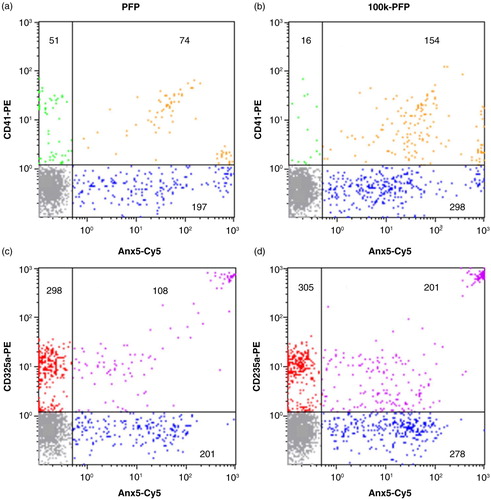
Table I. Extracellular vesicle (EV) concentrations measured by flow cytometry in platelet-free plasma (PFP) and 100k-PFP after double labelling with Anx5/CD41 or Anx5/CD235a