Figures & data
Table I. Embase search keywords and search algorithm
Table II. Inclusion and exclusion criteria for the analysis
Fig. 1. Flow diagram of reviewed publications.
The diagram shows the number of selected publications at the different search phases, including the Embase search results, and the additional articles retrieved using the ad hoc search.
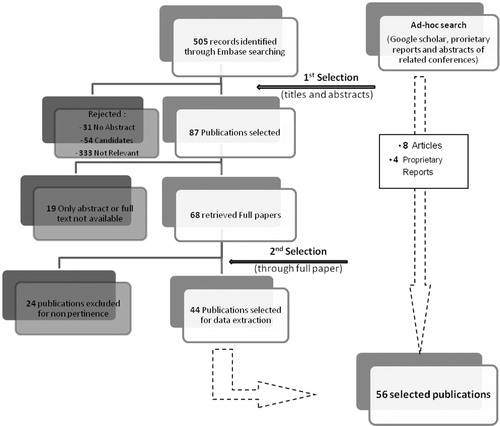
Fig. 2. Overview of selected publications.
(A) Distribution of publications by year of publication. (B) Distribution of publications by scope: The selected publications are distributed depending on their scope as attributed by us during the data extraction phase. The scope can be drug reformulation, drug repositioning, or both. (C) Distribution of publications by reason of selection; during the screening phases of the search, reasons for selection were recorded and we attributed five categories covering the overall search objectives: Background information, including definitions and general information; Approaches, any description of strategies for reformulations or repositioning; Cases, all case studies or examples of repositioned or reformulated products; Regulations, any regulatory implication; Pricing, pricing and market access of repositioned and reformulated products. (D) Distribution of publications by reason for selection and year of publication. (E). Distribution of publications by year of publication and scope (reformulation, repositioning, or both).
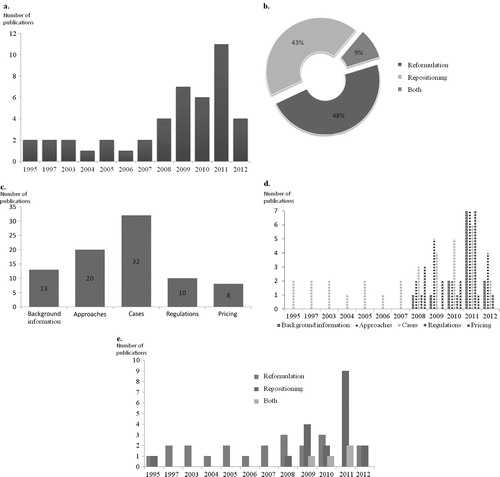
Table III. Examples of cases of reformulation/repositioning found in the literature
Table IV. Distribution of some cases according to different parameters
Table V. Overview of change of chemical or physical or clinical properties
Table VI. Overview of the changes according to the targeted pharmacokinetic parameters
Table VII. Non-consistency in the literature regarding repositioning and reformulations illustrated by cases found in our results
Fig. 3. Classification algorithm for drug repurposing.
Drug repurposing strategies (i.e., repositioning, reformulations, and combination) are illustrated as three distinct lines. Under each of these strategies, the cases can be classified according to specific criteria.
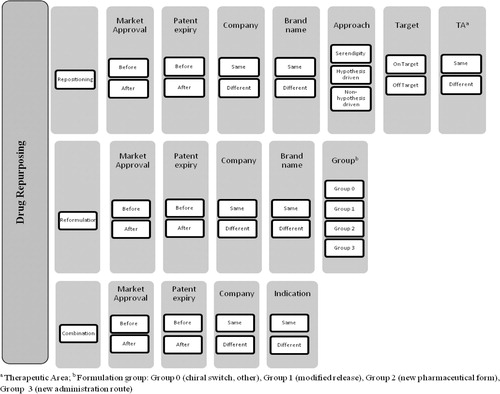
Fig. 4. Classification tree for repositioning of drugs.
Cases of drug repositioning are classified according to the parameters mentioned in the algorithm (Fig. 3). The presented tree is only a partial illustration of the classification.
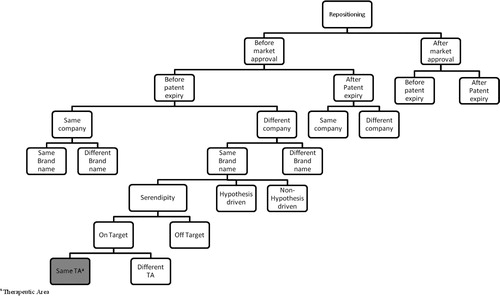
Fig. 5. Classification tree for drug reformulation.
Cases of drug reformulation are classified according to the parameters mentioned in the algorithm (Fig. 3). The presented tree is only a partial illustration of the classification.
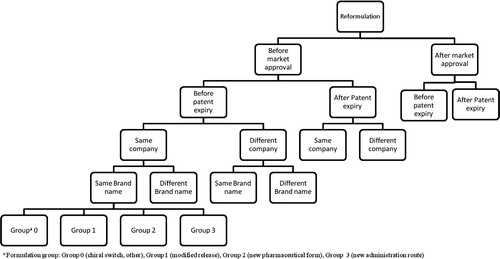
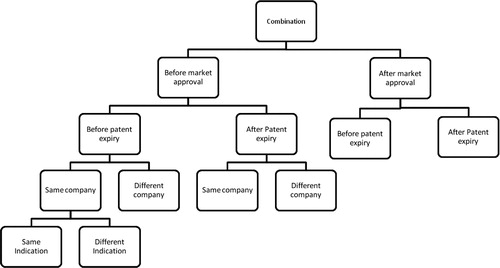
Fig. 6. Classification tree for drug combination.
Cases of drug combination are classified according to the parameters mentioned in the algorithm (Fig. 3). The presented tree is only a partial illustration of the classification.