
Figures & data
Fig. 1. Comparison of the estimated annual morbidity in the United States in the pre- and post-vaccine eras (Citation7).
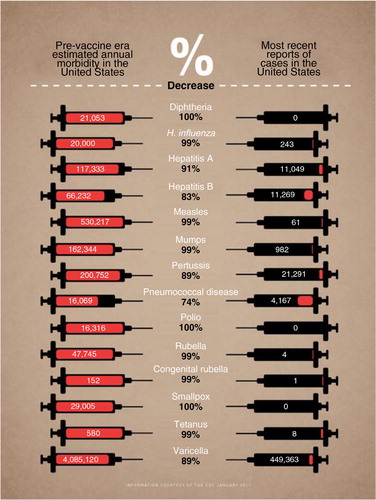
Table 1. Number of reported cases of vaccine-preventable diseases in the European region based on data from the WHO vaccine-preventable disease monitoring system
Table 2. Direct and indirect savings from vaccination
Table 3. Summary of an economic evaluation of the routine childhood vaccination programme in the US in 2009