596
Views
12
CrossRef citations to date
0
Altmetric
Original Research Articles

Cost savings of anti-TNF therapy using a test-based strategy versus an empirical dose escalation in Crohn's disease patients who lose response to infliximab

, MD, , MD, PhD, , PhD, , MD, , , PhD & , MD, PhD show all
Article: 29229 | Received 22 Jul 2015, Accepted 23 Sep 2015, Published online: 30 Oct 2015

Figures & data

Fig. 1.  Using Harel's statechart diagrams, description of changes in patients’ states over time according to events that occurred and treatment changes made.

Fig. 1.  Using Harel's statechart diagrams, description of changes in patients’ states over time according to events that occurred and treatment changes made.

Table 1. Model inputs according to clinical events

Table 2. Treatment costs through social insurance

Fig. 2.  Mean anti-TNF-therapy cost distribution by simulation (10,000 patients, 5 years).

Fig. 2.  Mean anti-TNF-therapy cost distribution by simulation (10,000 patients, 5 years).

Fig. 3.  Difference in mean costs of anti-TNF drugs between clinical scenarios 1 and 2 (10,000 patients, 5 years).

Fig. 3.  Difference in mean costs of anti-TNF drugs between clinical scenarios 1 and 2 (10,000 patients, 5 years).

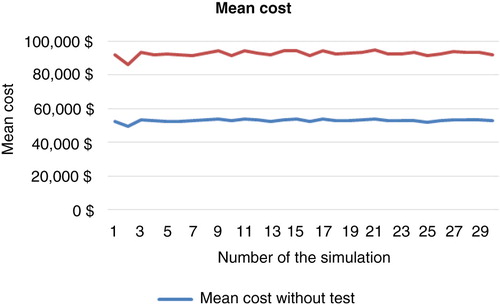
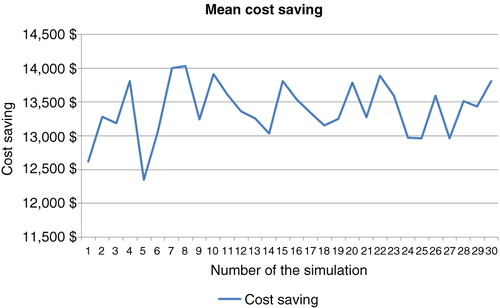
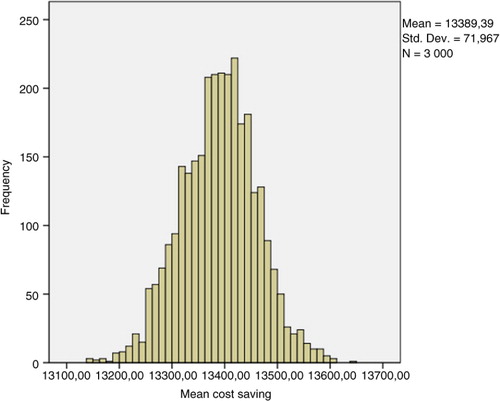
Table 3. Sample of 30 simulations using the bootstrap technique (10,000 patients, 5 years)

Table 4. Probabilities of treatment success following empirical drug optimization at every consultation

Table 5. Probabilities of the three outcomes of the diagnostic test, decision based on trough levels and antibodies to IFX, and efficacy of every therapeutic decision based on literature data

Table 6. Probabilities of the three outcomes of the diagnostic test, decision based on trough levels and antibodies to ADA, and efficacy of every therapeutic decision based on literature data

Fig. 4.  Comparative costs of anti-TNF therapy for the two strategies in 10,000 CD patients.

Fig. 4.  Comparative costs of anti-TNF therapy for the two strategies in 10,000 CD patients.

Fig. 5.  Bootstrapped histogram of cost savings (10,000 patients, 5 years).

Fig. 5.  Bootstrapped histogram of cost savings (10,000 patients, 5 years).

Fig. 6.  Comparative costs of anti-TNF drugs for the two strategies in 3,000 CD patients.

Fig. 6.  Comparative costs of anti-TNF drugs for the two strategies in 3,000 CD patients.

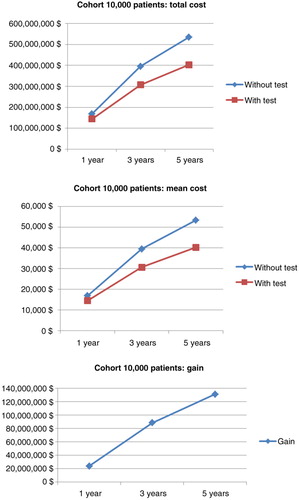
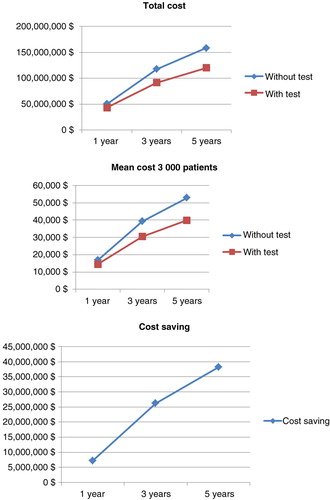
Table 7. Drug costs of anti-TNF therapy among 3,000 patients with empirical dose escalation compared with a test-based strategy