Figures & data
Fig. 1 Receptor-mediated epithelial export of polymeric Igs (pIgs). (A) Model for local generation of secretory IgA (SIgA) and secretory IgM (SIgM). J chain-containing dimeric IgA (IgA+J) and pentameric IgM (IgM+J) are produced by local plasma cells (left). Polymeric Ig receptor (pIgR), or membrane secretory component (SC), is synthesized by secretory epithelial cell in the rough endoplasmic reticulum and matures in the Golgi complex by terminal glycosylation (•-). In the trans-Golgi network (TGN), pIgR is sorted for delivery to the basolateral plasma membrane. The receptor becomes phosphorylated (-o) on a serine residue in its cytoplasmic tail. After endocytosis, ligand-complexed and unoccupied pIgR is delivered to basolateral endosomes and sorted for transcytosis to apical endosomes. Some recycling from basolateral endosomes to the basolateral surface may occur for unoccupied pIgR (not shown). Receptor recycling also takes place at the apical cell surface as indicated, although most pIgR is cleaved to allow extrusion of SIgA, SIgM and free SC to the lumen. During epithelial translocation, covalent stabilization of SIgA regularly occurs (disulfide bond between bound SC and one IgA subunit indicated), whereas free SC in secretions stabilizes the non-covalently bound SC in SIgM (dynamic equilibrium indicated). Modified from Brandtzaeg (Citation17). (B) Paired immunofluorescence staining for pIgR/SC (red) and IgA (green) in normal parotid tissue. The specimen had been washed in phosphate-buffered saline to extract diffusible extracellular proteins before fixation in cold ethanol (Citation16). IgA-producing plasma cells are scattered among acini but most of them occur adjacent to intercalated ducts. Note that there is variable uptake of IgA both in acini and ducts as evidenced by peripheral and some cytoplasmic staining of the epithelial cells (original magnification: ×250).
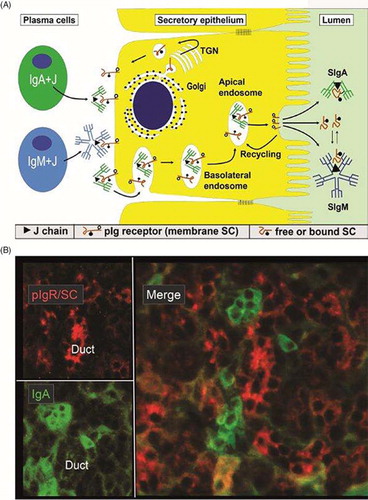
Table 1 J-chain positivity (%) of mucosal plasmablasts and plasma cells
Fig. 2 Elution patterns of Ig components in whole saliva after chromatography on Sephadex G-200 (column size, 2.5×37 cm; flow rate, 2.2 mL cm−2 h−1; fractions, 2.4 mL). Samples: 0.5 mL of 15 times concentrated unstimulated whole saliva from healthy individuals (left) or from patients with periodontitis (right). The distribution of Ig components was determined with specific antisera in single radial immunodiffusion (Mancini method) after three times concentration of the fractions. The squared diameters of the precipitin rings were used as concentration estimates. Modified from Brandtzaeg et al. (Citation13).
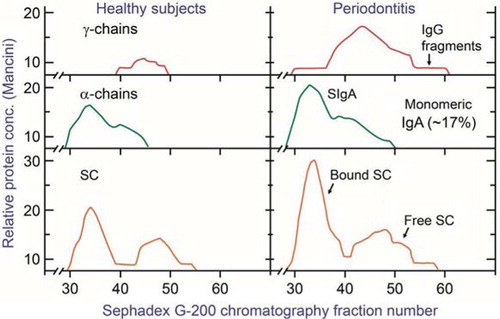
Table 2 Variations in mean results of salivary IgA determinations performed by the same laboratory (LIIPAT, 1970–91)
Fig. 3 Distribution of serum IgG in whole saliva and crevicular epithelium. (A) Regression line for the relationship between concentrations of IgG in whole saliva and the corresponding serum concentrations multiplied by the sum of the individual's periodontal index (PI) scores. Adapted from Brandtzaeg et al. (Citation13). (B) Immunofluorescence demonstration of IgG (red) and IgA (green) in monkey gingiva that had been directly alcohol-fixed in situ before being removed from the tooth. Middle part of the crevicular epithelium is shown. IgG and IgA permeate the connective tissue and particularly IgG appears intercellularly in the epithelium (arrows) (original magnification: ×125). Unpublished experiments (Brandtzaeg P and Tolo K).
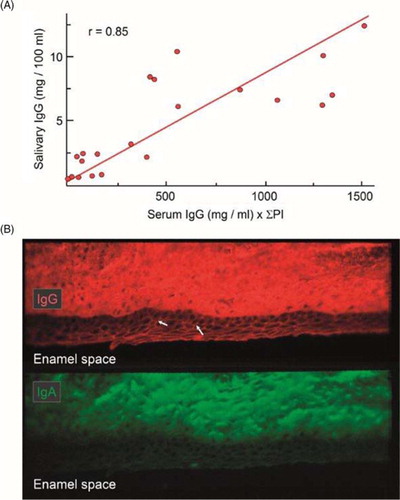
Fig. 4 Secretion rates (µg/min/gland) of amylase, lactoferrin, free secretory component (SC), and secretory IgA (SIgA) in parotid fluid obtained before (unstimulated), during (stimulated), and after (rest) 80 min of acid gustatory stimulation of the secretion. Maximum average secretion rate in five subjects is for each component given as 100% on the vertical axis. Free SC and lactoferrin were undetectable in some stimulated samples, and data for these components are based on only four or three samples, respectively. Absolute figures (µg/min) and standard deviations (vertical lines) are therefore not indicated for the corresponding group maxima, while the average response for each component is indicated above the columns. Adapted from Brandtzaeg (Citation39).
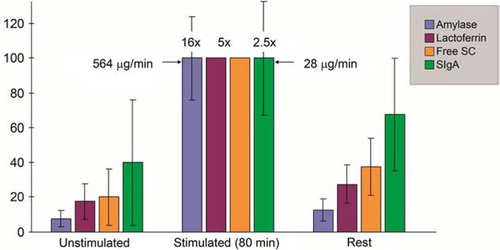
Table 3 Effect of different stressors on salivary IgA levels
Fig. 5 Merge of paired immunofluorescence staining for IgA (green) and IgM (red) in section of saline-extracted and ethanol-fixed specimen (Citation16) of normal submandibular salivary gland. There is a dominance of IgA-producing plasma cells mainly adjacent to ducts. Note that there is a variable uptake mainly of IgA both in acini and ducts as evidenced by peripheral and some cytoplasmic staining of epithelial cells, but the luminal ring in striated duct at the middle top might represent adherent IgA from the secretion (original magnification: ×125).
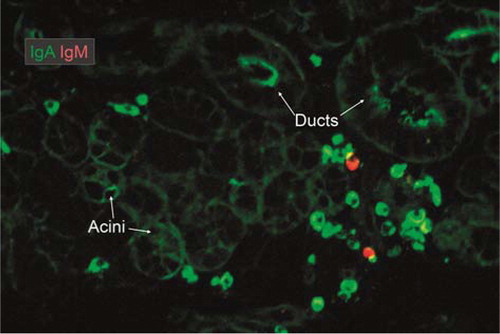
Fig. 6 Average tissue densities of plasmablasts and plasma cells producing different Ig classes at various normal secretory sites as indicated. Representative areas illustrating merge of immunofluorescence staining (see color key) are shown for submandibular gland and colonic lamina propria. Based on published data from the author's laboratory.
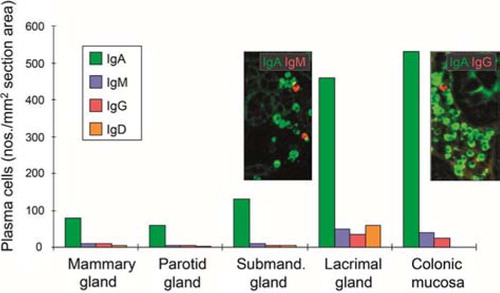
Fig. 7 Merge of paired immunofluorescence staining for IgA (green) and IgG (red) in section of saline-extracted and ethanol-fixed specimen (Citation16) of buccal minor salivary gland. Note that there is a relatively dense population of plasma cells compared with major salivary glands (cf. ), and that IgG-producing cells are quite abundant at the periphery. Both ducts and serous parts of acini show faint selective staining for IgA, reflecting external transport (original magnification: ×80).
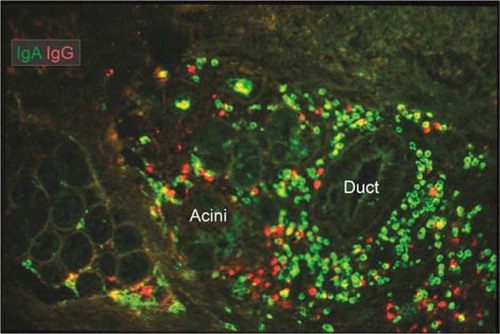
Fig. 8 Relationship between local production of Ig isotypes by parotid plasma cells and Ig transfer by secretory epithelium. (A) Compared with the local production, export of IgA into stimulated parotid secretion is clearly favored over export of IgM (and IgG and IgD), whereas translocation of the two subclasses of IgA appears to be handled equally well by the glandular epithelium. (B) Comparison of epithelial translocation of dimeric IgA (pIgA) and pentameric IgM (pIgM) was performed in vitro with polarized MDCK cells transfected with the human polymeric Ig receptor. Cells were incubated with 125I-labelled pIgA or pIgM for 2 h at 4oC, washed for 10 min at 4oC, and chased at 37oC for different times as indicated. Translocation is expressed as the cumulative appearance of 125I-pIgA and 125I-pIgM in the apical medium. Each point represents mean result of three filters for pIgA and pIgM translocation at 50 nM ligand concentration. Adapted from Norderhaug et al. (Citation29).
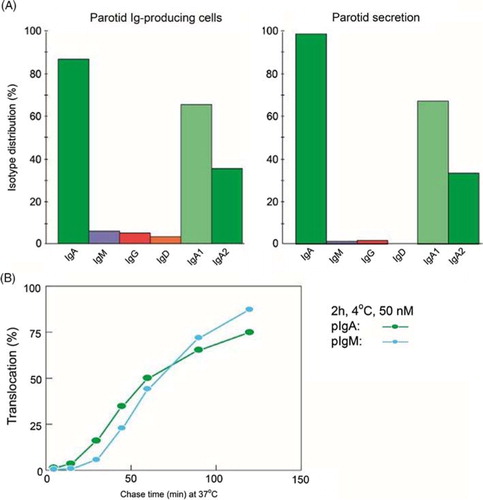
Fig. 9 Generation of secretory IgA (SIgA) and free secretory component (SC). SIgA is formed as a hybrid antibody molecule stabilized by a disulfide bridge between the two cell products. The amount of dimeric IgA (pIgA) produced by a plasma cell depends on its level of J-chain expression, which generally is high in mucosal and glandular tissue. Inset (left) shows direct demonstration of abundant cytoplasmic expression of pIgA (p) in most parotid plasmablasts and plasma cells achieved by in vitro affinity test with free SC on tissue section as described (Citation10), whereas a single cell producing only monomers (m) is seen in this field. On average, approximately 50% of SC occurring in various secretions is in a free form (unoccupied by ligand). The immunostained panel is from Brandtzaeg (Citation43).
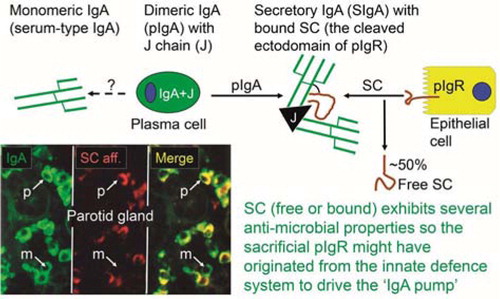
Fig. 10 Relative production of Ig classes and IgA subclasses at human secretory effector sites. (A) Average percentage distribution of plasmablasts and plasma cells producing different Ig classes in various human secretory tissues from healthy controls and subjects with selective IgA deficiency. Based on published data of the author's laboratory. (B) Average percentage subclass distribution of IgA-producing plasmablasts and plasma cells in human lymphoid and normal secretory tissues. Based on published data from the author's laboratory except data for bronchial mucosa. Adapted from Brandtzaeg and Johansen (Citation34).
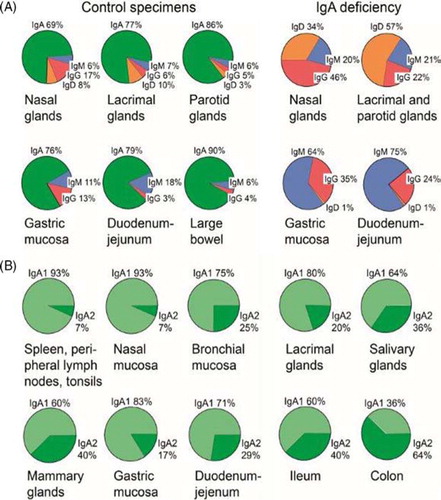
Fig. 11 Effect of tonsillar immunization with killed Streptococcus sobrinus on experimental bacterial tooth colonization and dental caries in a rabbit model. Comparison is made with results obtained in non-immunized (top) or non-inoculated (bottom) rabbits and after systemic or intragastric (enteric) immunization. Adapted from Fukuizumi et al. (Citation94).
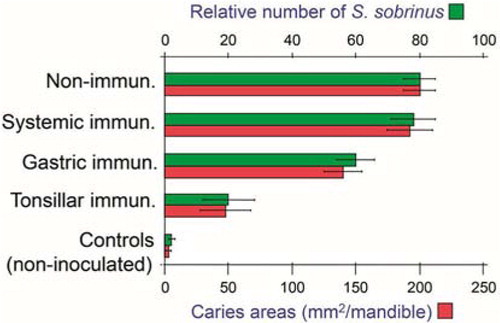
Fig. 12 Homing properties of human mucosal memory/effector B cells. Putative scheme for compartmentalized migration of B cells from inductive (top) to effector (bottom) sites. Depicted are more or less preferred pathways (graded arrows) presumably followed by mucosal B cells activated in nasopharynx-associated lymphoid tissue (NALT) represented by palatine tonsils and adenoids, bronchus-associated lymphoid tissue (BALT), and gut-associated lymphoid tissue (GALT) represented by Peyer's patches, appendix, and colonic-rectal isolated lymphoid follicles. The principal homing receptor profiles of the respective B-cell populations, and adhesion/chemokine cues directing extravasation at different effector sites, are indicated (pink and blue panels) – those operating in lactating mammary glands apparently being shared for NALT- and GALT-derived cells. Homing molecules integrating airway immunity with systemic immunity are encircled in red. Adapted from Brandtzaeg (Citation130).
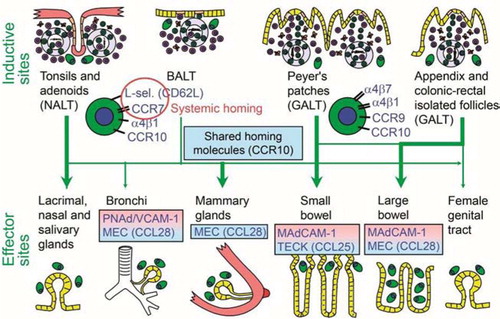
Fig. 13 Development of the secretory IgA (SIgA) system in parotid glands and saliva. (A) Ontogeny of Ig-producing cells and epithelial expression of the polymeric Ig receptor (pIgR/SC) in parotid glands. Based on data from Thrane et al. (Citation46). (B) Ontogeny of SIgA as determined in unstimulated whole saliva. Based on data from Fitzsimmons et al. (Citation114). Note that both the density of IgA+ plasmablasts and plasma cells as well as the SIgA level at about 6 months of age has to increase approximately 5 times to match the adult values.
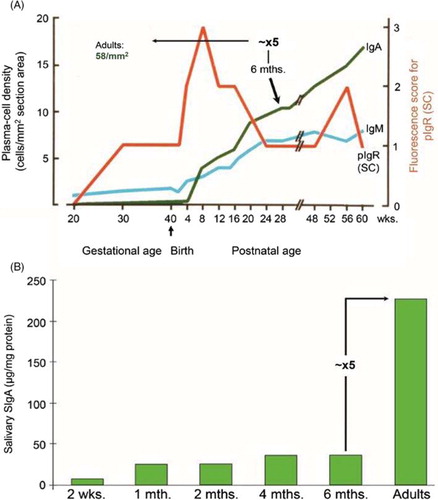
Table 4 Antimicrobial effects of secretory IgA antibodies
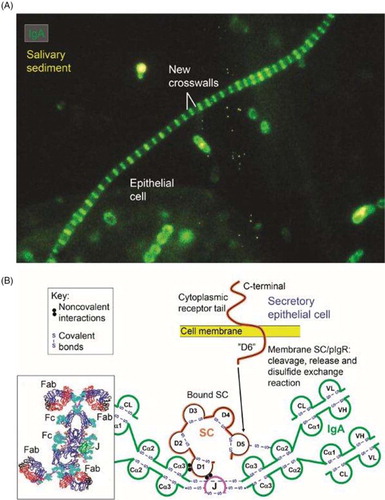
Fig. 14 Synopses of functional properties of salivary IgA with the structural basis for the excellent antimicrobial binding activity of secretory IgA (SIgA). (A) Direct immunofluorescence staining of salivary sediment to demonstrate IgA adsorbed onto oral bacteria in vivo. Epithelial cell is faintly visualized because of autofluorescence. Numerous cocci (mainly diplococci) – partly adhering to epithelial cell – are coated with IgA, which is also bound to the older cell-wall segments of streptococci forming long chains, whereas new crosswalls formed in vitro after sampling are negative as indicated. Adapted from Brandtzaeg et al. (Citation66) (original magnification: ×2000). (B) Domain interactions in the formation of SIgA based on data reviewed in Norderhaug et al. (Citation29). Non-covalent domain interactions are shown between the J chain (J) and the extracellular domain 1 (D1) of bound SC, and covalent disulfide bonding is indicated between cystein 467 or 502 in D5 of SC and cystein 311 in the Cα2 domain of one of the two IgA subunits. Some studies have indicated that there may be two J chains in dimeric IgA (Citation30). Insert to the lower left is from modeling data for dimeric IgA1 based on X-ray and neutron scattering in solutions published in Bonner et al. (Citation137). Note the T-shape of the Fab fragments, allowing for antibody binding to large particles like bacteria. V, variable region; C, constant region; L, light chain; H, heavy chain; Fab, fragment antigen binding; Fc, fragment crystallizable.