Figures & data
Fig. 1 A diagram of the sampling days and the daily CDFF regime for 17 days (experiment 1) and 24 days (experiment 2). Each day, the DMM supply was interrupted by 5-min-long sucrose pulses (vertical arrows). The asterisk (*) depicts the moment of sampling.
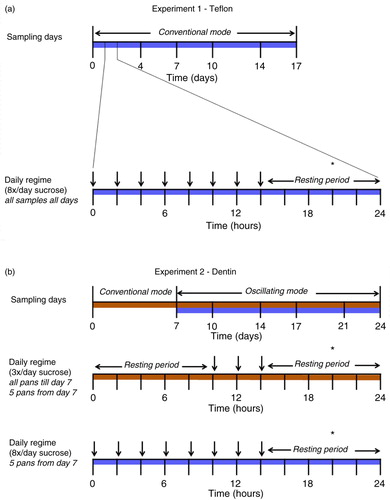
Fig. 2 The effects of biofilm thickness and age on red fluorescence, biofilm grown on Teflon. (a) Example of one CDFF pan per time point (screw thread for pan removal covered), (b) different depth settings of the plugs. (c) Intensity of red fluorescence (peak amplitudes for the different peak wavelengths within the red area of the spectrum) in arbitrary units per biofilm thickness. (d) Intensity of red fluorescence (peak amplitudes for the different peak wavelengths within the red area of the spectrum) in arbitrary units per biofilm age.
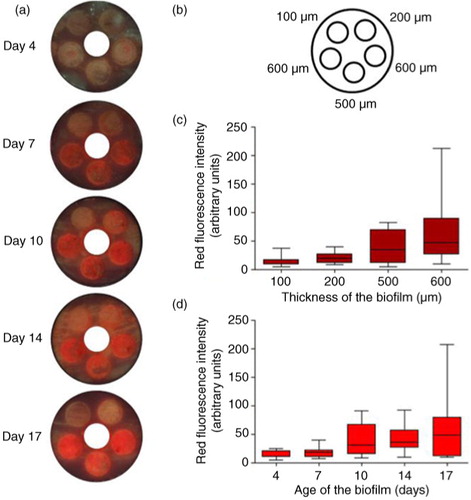
Fig. 3 The effect of sucrose frequency on mineral loss and red fluorescence. Mineral loss from dentin plotted against intensity of red fluorescence (total amount of peaks within the red area of the spectrum) in arbitrary units. Biofilm age is indicated with different colors for the three times-a-day sucrose group (closed circles) and the eight times-a-day sucrose group (open circles). Remarkable is the increase in red fluorescence intensity at day 24 (red circles) in both groups. The thickness of all biofilms was 600 µm.
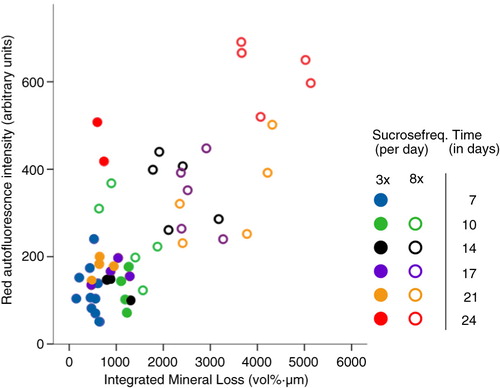
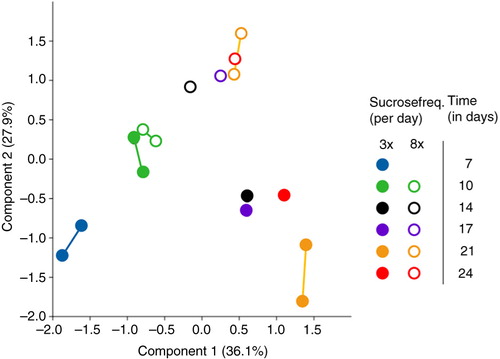
Fig. 4 Principal component analysis (PCA) plot of microbiome samples from all time points. The drawn lines link two samples from the same condition group: at day 7 between different pans, at day 10 and 21 within one pan. Biofilm age is indicated with different colors for the three times-a-day sucrose group (closed circles) and the eight times-a-day sucrose group (open circles). The thickness of all biofilms was 600 µm.