Figures & data
Table 1. Demographic and clinical characteristics of study cohort
Table 2. HOMINGS and HOMIM capacities based on Human Oral Taxonomy (HOT) designation.
Table 3. Dental plaque microbiome composition by HOMIM and HOMINGS
Fig. 1. HOMINGS versus HOMIM comparison of total taxa relative proportion per patient. Total taxa (i.e. species common to both technologies) relative proportion for a patient was calculated by dividing the sum of the intensity scores (HOMIM) or hits (HOMINGS) of all bacterial taxa of the patient by the total number of these values for all 96 patients. (a) Differences in relative taxa proportions are illustrated by patient to patient line chart (HOMINGS [blue]; HOMIM [red]). These differences were not statistically significant overall (p=0.617, Wilcoxon signed-rank test). (b) Grubbs test identified six patients as outliers, with patient 26 (Pt26) representing the most prominent outlier. Removing Pt26 from the analysis also showed that differences in taxa relative proportions were overall not statistically significant (p=0.805).
![Fig. 1. HOMINGS versus HOMIM comparison of total taxa relative proportion per patient. Total taxa (i.e. species common to both technologies) relative proportion for a patient was calculated by dividing the sum of the intensity scores (HOMIM) or hits (HOMINGS) of all bacterial taxa of the patient by the total number of these values for all 96 patients. (a) Differences in relative taxa proportions are illustrated by patient to patient line chart (HOMINGS [blue]; HOMIM [red]). These differences were not statistically significant overall (p=0.617, Wilcoxon signed-rank test). (b) Grubbs test identified six patients as outliers, with patient 26 (Pt26) representing the most prominent outlier. Removing Pt26 from the analysis also showed that differences in taxa relative proportions were overall not statistically significant (p=0.805).](/cms/asset/6cc79749-6d23-4147-aa91-95d9a1547b57/zjom_a_11821315_f0001_ob.jpg)
Fig. 2. Dental plaque bacterial genera composition by HOMINGS with added taxa identification capacity compared to HOMIM. *HOMINGS microbiome profiling of dental plaque samples from a patient cohort (n=96) shows a large increase (>100%) in the detection of Actinomyces, Fusobacterium, Leptotrichia, and Prevotella genera compared to HOMIM, likely due to additional genera probes. Relative proportions per genus were calculated based on total hits by HOMINGS or total intensity scores by HOMIM per 96 patients. Genera accounting for 96% of total hits by HOMINGS are represented.
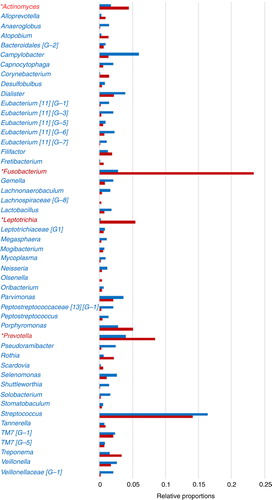
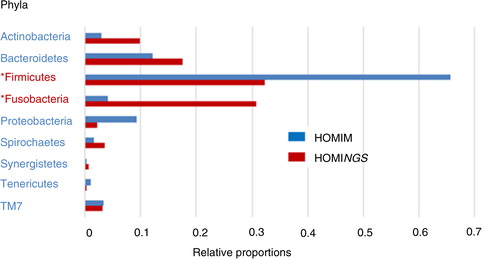
Fig. 3. Dental plaque bacterial phyla composition by HOMINGS with added taxa identification capacity compared to HOMIM. *HOMINGS microbiome profiling of dental plaque samples from a 96 patients cohort shows a large shift in relative proportions for Fusobacteria (3.8% HOMIM vs. 29.4% HOMINGS) and Firmicutes (64.4% HOMIM vs. 32.6% HOMINGS). Relative proportions per phylum were calculated based on total hits by HOMINGS or total intensity score by HOMIM per 96 patients. Chloroflexi, GN02 and SR1 were omitted due to negligible representation.