
Figures & data
Table 1 Anthropometric and spirometric data of included subjects divided according to age ranges (n=4,730)
Table 2 Anthropometric and spirometric data of included subjects divided according to OVD definitions (n=4,730)
Fig. 1 Distribution of included subjects with respect to obstructive ventilatory defect definitions and smoking status: (a) operational definition ‘negative’; (b) operational definition ‘positive’.
FEV1, first-second forced expiratory volume; FVC, forced vital capacity; LLN, lower limit of normal; n, number; %: percentage of smokers with OVD; FEV1/FVC LLN values are mean±SD.
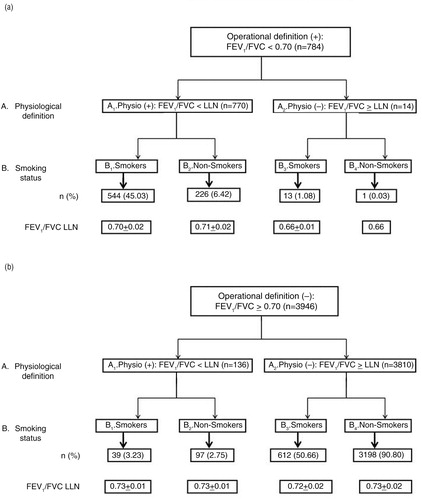
Table 3 Results of some studies aiming to compare the OVD operational and physiological definitions