Figures & data
Figure 1. Levels of DNA damage after exposure to hydrogen peroxide evaluated by the comet assay.
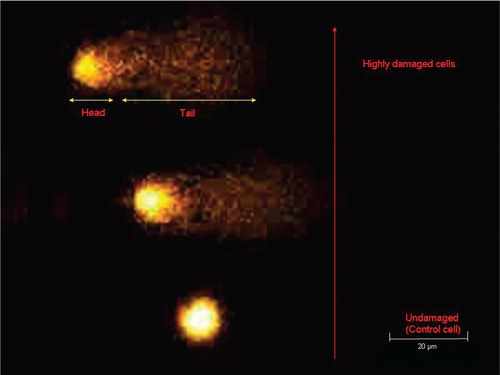
Figure 2. Flowchart showing the comet assay for single-cell gel electrophoresis to determine DNA damage (12).
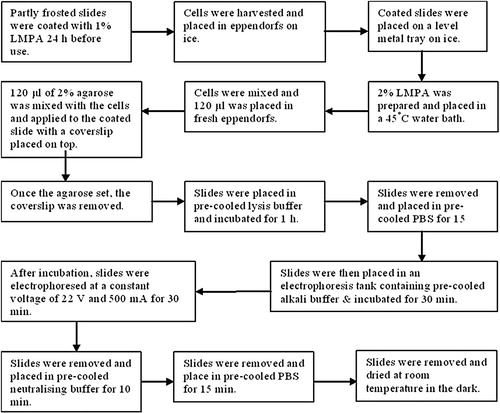
Figure 3. Comet assay of the effect of duration of incubation with hydrogen peroxide on DNA damage: untreated HepG2 cells (A) and HepG2 cells treated with 50 µM H2O2 for 5 min (B), 1 h (C) or 24 h (D). Longer tails indicate more damage.
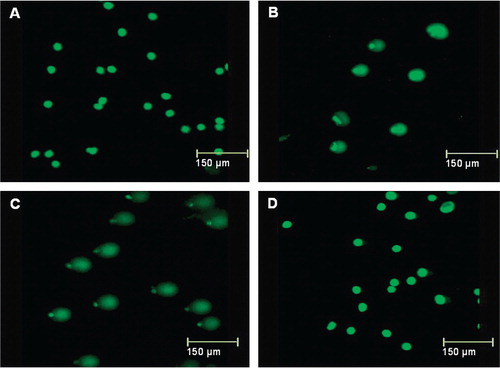
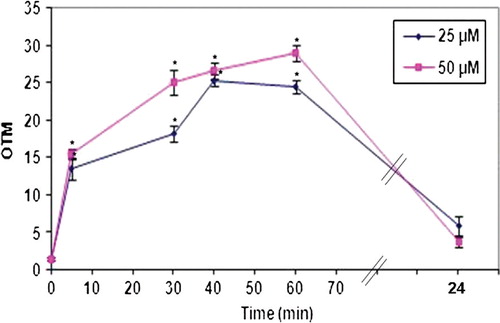
Figure 4. Dose and time dependence of the extent of DNA damage. HepG2 cells were treated with 25 µM or 50 µM H2O2 for 5, 30, 40 min, 1 h or 24 h and DNA damage was assessed by the comet assay. Damage is expressed in olive tail moment (OTM). The values are the mean±SEM of 50 cells from two pooled wells (25 cells per slide). * p<0.001 (One-Way ANOVA) compared to control.