Figures & data
Table 1. Age and somatic parameters distribution patterns in hypertensive patients and controls
Table 2. Duration of hypertension by gender
Table 3. Comparison between right and left renal volume in male and female hypertensive patients and controls
Figure 1. Scatter plot showing decrease in renal volume as age increases in hypertensive patients.
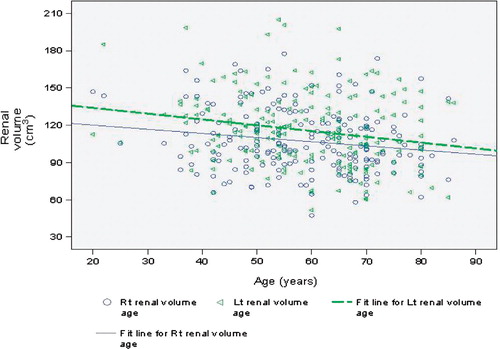
Figure 2. Scatter plot showing increase in renal volume as BMI increases in hypertensive patients.
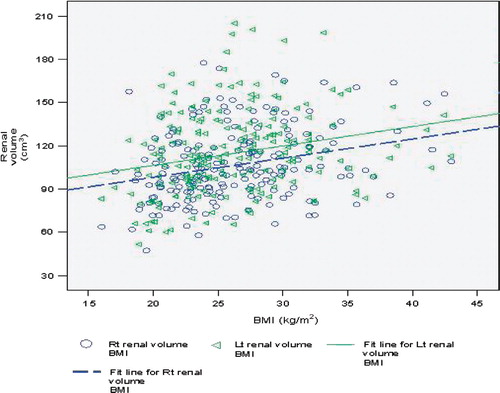
Figure 3. Scatter plot showing increase in renal volume as BSA increases in hypertensive patients.
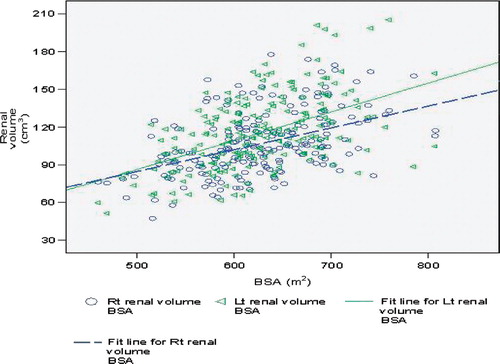
Table 4. The renal volume of both kidneys by BMI in hypertensive patients and controls