Figures & data
Figure 1 Age distribution of participants.
ENS, exclusive narghile smokers; ECS, exclusive cigarette smokers. a p < 0.05 (χ2 test): ENS vs. ECS.
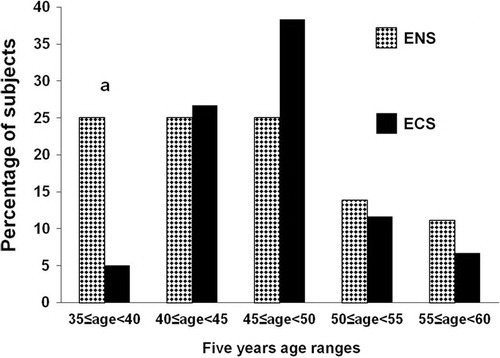
Table 1. Subjects’ characteristics: exclusive narghile smokers (ENS, n=36) and exclusive cigarette smokers (ECS, n=106)
Table 2. Comparison of the plethysmographic profiles of exclusive narghile smokers (ENS, n=36) and exclusive cigarette smokers (ECS, n=106)
Supplemental material