Figures & data
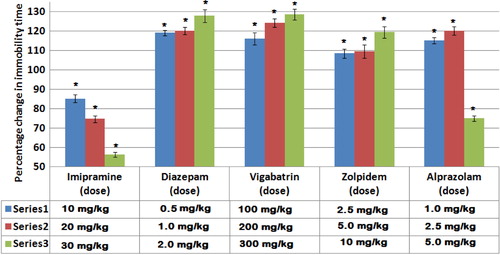
Fig. 1 Effects of drug treatments on the percentage change in the immobility time in FST. Columns represent Mean±S.E. Drugs were administered 1 h before the test session and the duration of immobility was measured for 5 min. *P<0.001 as compared to control group using unpaired Student's t-test (two samples assuming equal variances) (n=6).