
Figures & data
Table 1 Clinical characteristics of the two groups: smokers’ Non-COPD and COPD
Table 2 Fractional exhaled nitric oxide (FeNO) and plethysmographic data of the two groups: smokers’ Non-COPD and COPD
Table 3 Correlation coefficient between fractional exhaled nitric oxide (FeNO) and lung function data and physical activity score in the two groups: smokers’ Non-COPD (n=29) and COPD (n=16)
Fig 1. Oxidative stress levels of the two groups: smokers Non-COPD (Non-COPD) and smokers COPD patients (COPD). a) Malondialdehyde (MDA) level measured in 26 Non-COPD and 15 COPD smokers. b) Glutathione (GSH) level measured in 24 Non-COPD and 15 COPD smokers. c) Protein sulfhydryl (PSH) level measured in 24 Non-COPD and 16 COPD.
Data are shown as box-and-whisker plots illustrating the mean (), ±standard-error (), and 95% confidence interval (). p (t-test): comparison of levels of oxidative stress markers between the two groups.
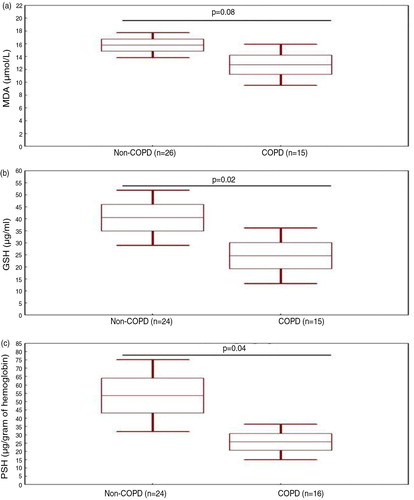
Table 4 Oxidative stress markers of the two groups (smokers’ Non-COPD and COPD) divided according to the obesity status
Table 5 Correlation coefficient between oxidative stress markers and lung function data and physical activity score in the two groups: smokers’ Non-COPD (n=29) and COPD (n=16)