Figures & data
Table 1 Proportion of rotavirus diarrhea in children aged≤5
Table 2 Cost of rotavirus treatment among children aged≤5
Table 3 Input variables for estimating the cost-effectiveness of rotavirus vaccination with baseline, minimum (Min), and maximum (Max) values
Table 4 Health outcomes and cost of treatment of rotavirus patients in no vaccination and vaccination scenarios
Table 5 Incremental cost-effectiveness analysis of rotavirus vaccination
Table 6 Including the indirect cost (US$) in the economic evaluation of the vaccine
Fig. 1 Sensitivity analysis (tornado diagram) of the incremental cost per QALY gained analyzed from the health provider perspective (example: the lower the cost of the vaccine, blue color, the lower the cost-effectiveness result; the color changes at the baseline value of $8,972, see ).
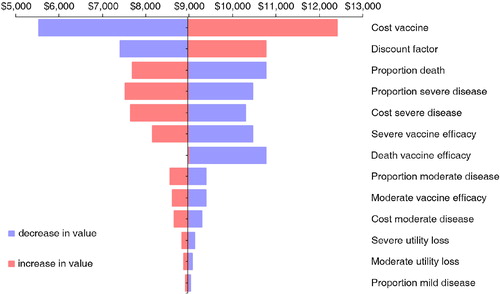
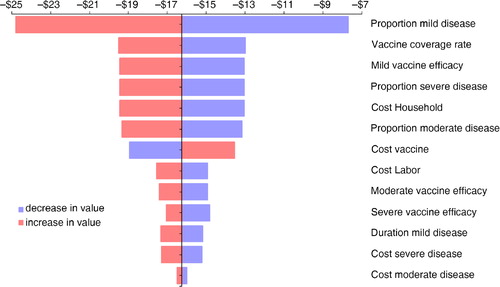
Fig. 2 Sensitivity analysis (tornado diagram) on the cost difference per child in the birth cohort (Vaccination – No Vaccination) analyzed from a societal perspective (example: the lower the proportion of mild disease, blue color, the lower the cost savings on the X-axis).