Figures & data
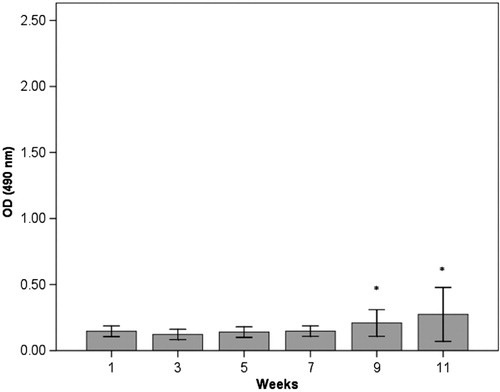
Fig. 1. Longitudinal study of anti-HSP60 level in serum in the immunised group (group 1). Bars represent level of anti-HSP60 analysed by ELISA in blood samples taken every other week, before each immunisation. Notes: **There is a significant increase in anti-HSP60 level from week 1 to week 11 (p < 0.01). Bars represented by * are significantly different from same week in group 3 (). Results are presented as mean optical density (OD) values measured at 490 nm. The vertical lines represent the standard deviation.
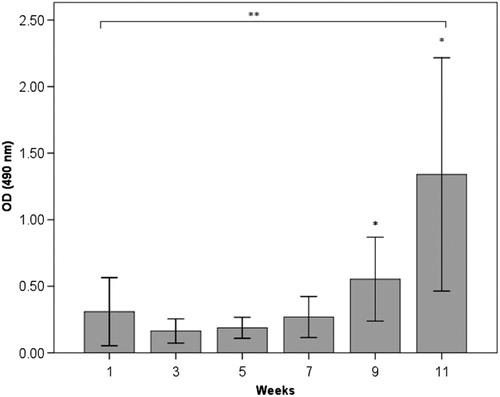
Fig. 2. Longitudinal study of anti-HSP60 level in serum in the dived group (group 2). Notes: Bars represent level of anti-HSP60 analysed by ELISA in blood samples taken every other week/dive, immediately after surfacing/decompression. There is no change in circulating anti-HSP60. Results are presented as mean OD values measured at 490 nm. The vertical lines represent the standard deviation.
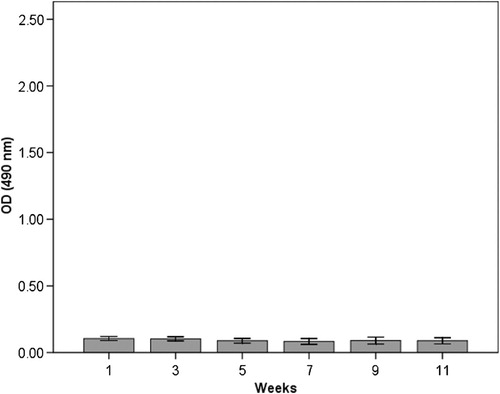
Fig. 3. Longitudinal study of anti-HSP60 level in serum in the immunised and dived group (group 3). Notes: Bars represent level of anti-HSP60 analysed by ELISA in blood samples taken every other week/dive immediately after surfacing/decompression. In contrast to the immunised rats (group 1), there is no significant change in level of circulating anti-HSP60.Bars represented by * are significantly different from same week in group 1 (Fig. 1).Results are presented as mean OD values measured at 490 nm. The vertical lines represent the standard deviation.