Figures & data
Supplementary Table 1. Distribution of clinical isolates in Zhejiang Province from 2000 to 2009
Fig. 1. Distribution of clinically isolated Enterobacteriaceae in Zhejiang Province from 2000 to 2009.
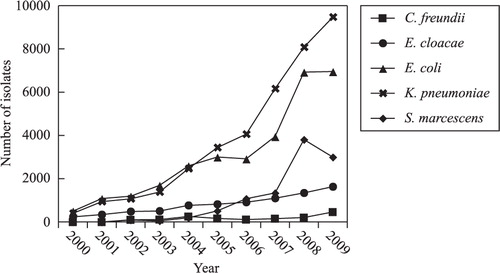
Fig. 2. Annual changes in the detection ratio of Enterobacteriaceae that produced ESBLs from clinically isolated Enterobacteriaceae.
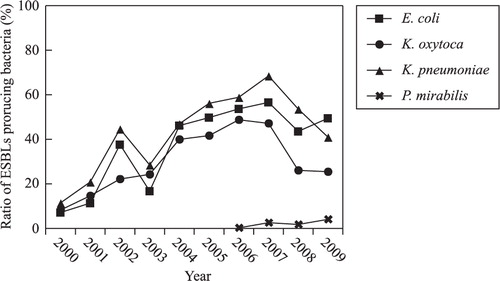
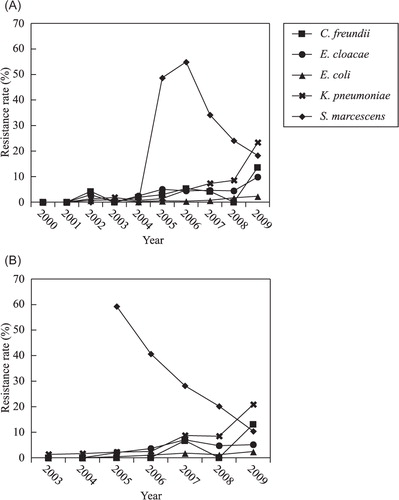
Fig. 3. Annual changes in the resistance rate of various Enterobacteriaceae species against carbapenem from 2000 to 2009. (A) Imipenem, (B) meropenem.
Supplementary Table 2. Variation of antimicrobial susceptibility of Enterobacteriaceae isolated from 2000 to 2009
Fig. 4. Prevalence of carbapenem-resistant Enterobacteriaceae from 10 areas in Zhejiang Province from 2000 to 2009. The year shown inside the area indicated the year when the first carbapenem-resistant Enterobacteriaceae was identified from this area. The sign of different color shown in the area indicates the different carbapenem-resistant Enterobacteriaceae so far have been identified from this area.
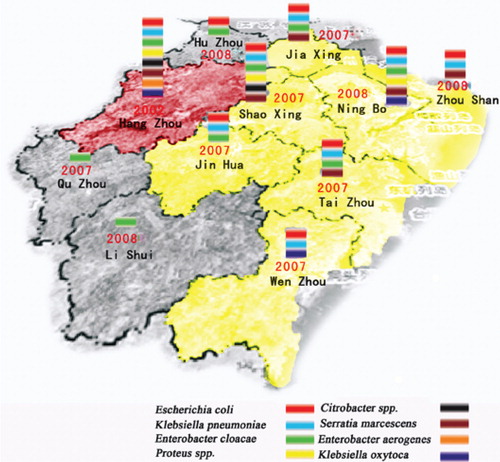
Table 1. Detection of carbapenem-resistant Enterobacteriaceae in different districts of Zhejiang Province
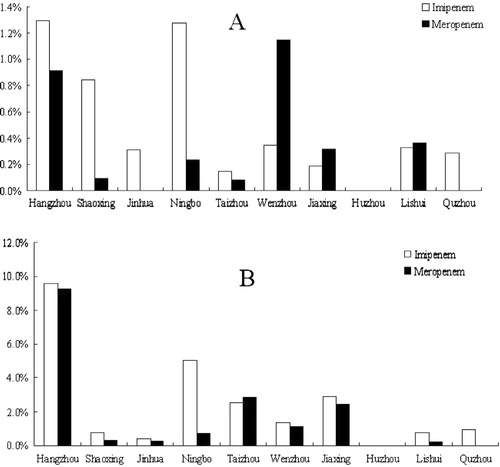
Fig. 5. Resistant rates of E. coli (Panel A) and K. pneumoniae (Panel B) isolated from different areas of the province against imipenem (open bars) and meropenem (filled bars).