Figures & data
Fig. 1. Earthworm survival curves. The color of the curves indicate feeding regime. The significance of the difference between the groups was determined by the Breslow-Gehan test.
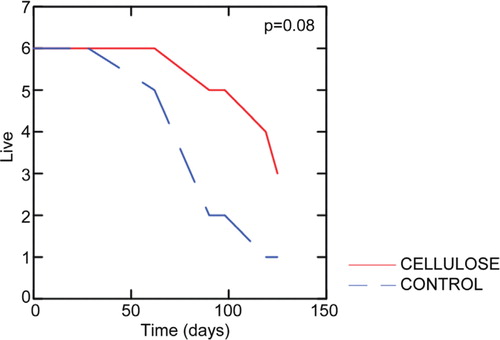
Table 1. DNA sequence of the MCR components
Table 2. Classification of MCR components by the RDP hierarchical classifiera
Fig. 2. Gut microbiota clustering based on the concentration profiles for the MCR components. The concentration of each of the components in each sample is indicated by the color code. The clustering represents the relatedness based on the centroide linkage.
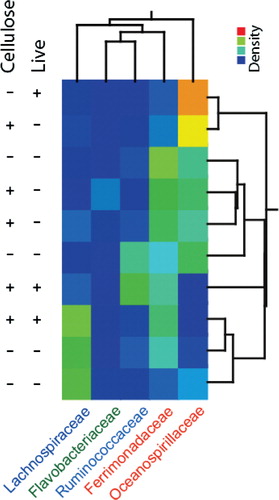
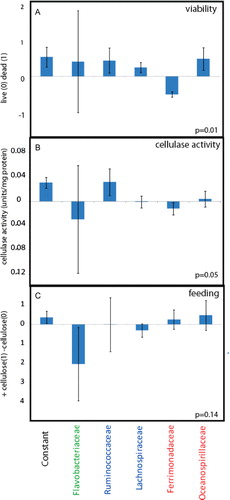
Fig. 3. PLS regressions with the gut microbiota as predictors. (A) Live/dead correlations, (B) correlations to cellulase activity, and (C) correlations to feeding regime. The regression coefficients with standard deviations are shown.