Figures & data
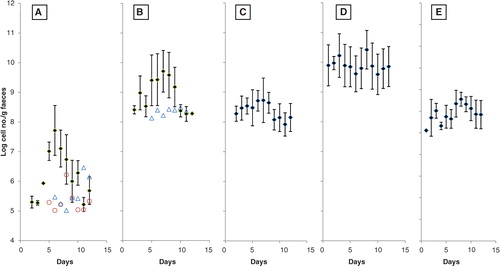
Fig. 1. Kiwifruit consumption altered fecal bacteria content. A: Lactobacilli; B: Bifidobacteria; C: Enterococci; D: Clostridia; E: Bacteroides. Freeze-dried kiwifruit were given on days 4–7. The data points on day 2–4 represent the pre-experiment baseline. The data points from day 8 onward represent the washout period. The vertical bars represent the standard deviations from the average.