Figures & data
Table 1. Some known exorphins are listed (one letter code)
Table 2. Area under the 215 nm curve eluting after hippuric acid. Arbitrary units
Fig. 1. The HPLC pattern of a normal urine equivalent to 250 nanomoles creatinin.
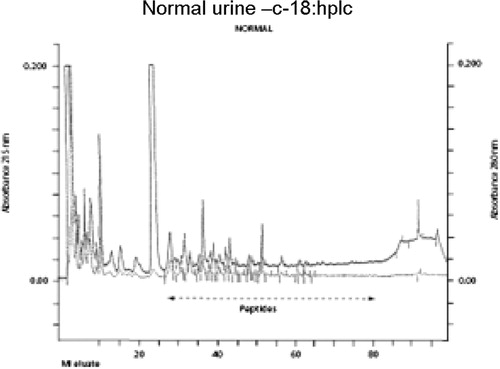
Fig. 2. The HPLC pattern of a boy with infantile autism.
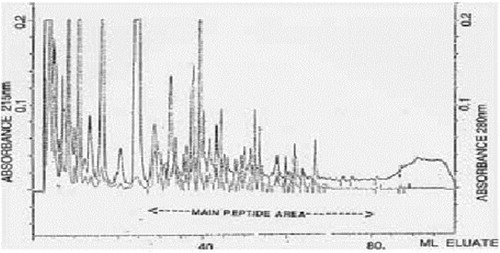
Fig. 3. Bottom trace amino acid analysis before hydrolysis, and top trace after hydrolysis in 6 M HCl in closed vials at 1108C for 16 hours. The late eluting (to the right) large peak is ammonia.
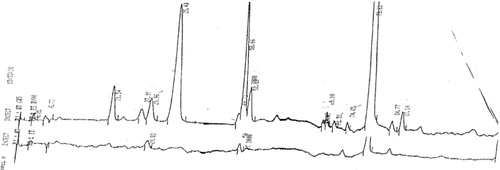
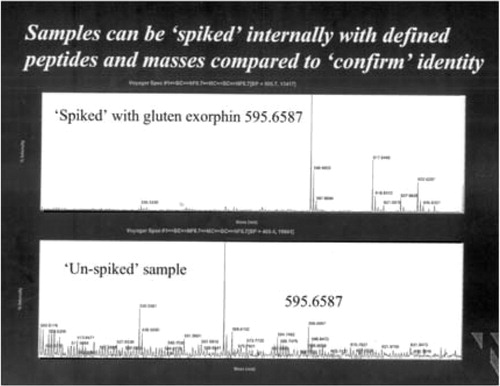
Fig. 4. Demonstration of glumorphin A-5 by MS/MS (fragmentation). Top trace is synthetic standard, and bottom trace Glumorphin A5 isolated from regressive autistic children's urine. Declustering potential was set at 20 and collision energy at 30. The X axis has been extended in bottom trace to secure against hidden ion peaks.
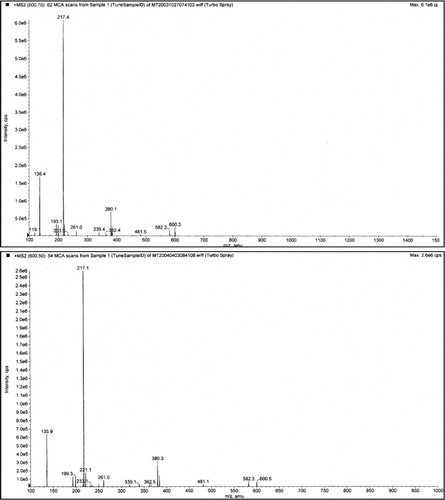
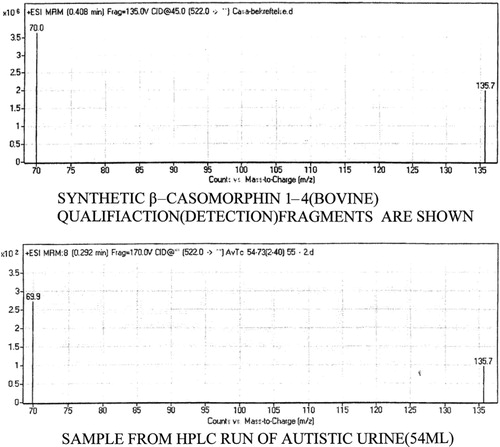
Fig. 5. Casomorphin 1–7. The casomorphin 1–7 standard is the top trace, from CPDD bottom trace. The peak appearing after the intact ion could be removed by increasing the declustering potential. It is shown here to illustrate the strong propensity for peptides to form aggregates and adducts. Declustering here is 20 and collision potential is 70.
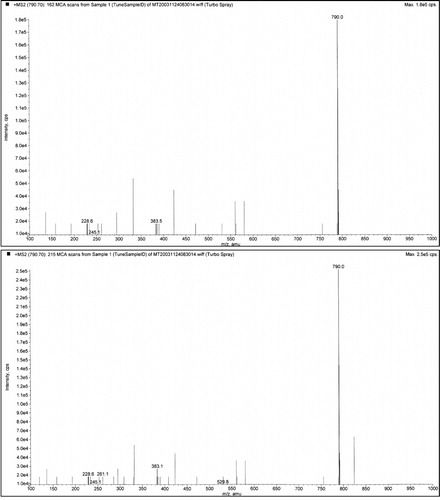
Table 3. Year open study of dietary intervention in 15 patients
Table 4. GF/Cf diet with control group for pair wise matched and randomly assigned autistic children Citation52
Fig. 6. Overloading normal person with gluten and gliadin for three days resulted in a demonstrable glumorphin B 5. Topp trace is spiked with standard peptide, bottom trace urine pattern after three days excessive gluten exposure.