Figures & data
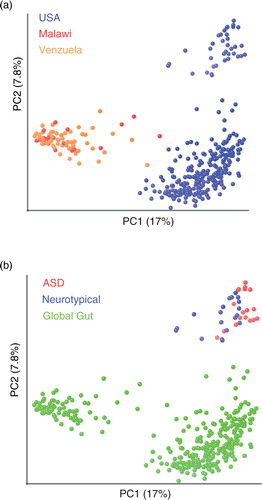
Fig. 1 Four most differentially abundant genera when children with ASD and neurotypical children are compared (blue box: neurotypical children; red box: children with ASD). (Figure from Kang et al. (Citation21) under an open access license of PLoS journals called the Creative Commons Attribution (CC-BY) license.)
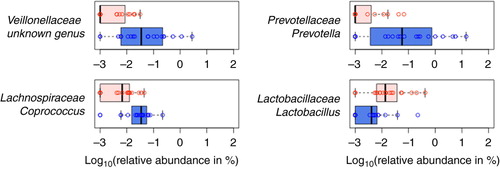
Fig. 2 Schematic of relationships among pairs at the 97% OTU level. Each grey or yellow circle represents an individual OTU, and paired OTUs are connected by a line if there is a high positive correlation (Pearson's R>0.8) among neurotypical samples. When paired OTUs were also present from autistic samples, lines connecting each OTU pair are highlighted either in blue or red depending on their correlation among autistic samples (either positive or negative correlation, respectively). If at least one OTU in the pair was absent from autistic samples, the connecting line is colored in green to show the changes in microbial interactions that resulted from the absence of the OTUs in children with ASD. Prevotella copri-like OTUs are highlighted in yellow to demonstrate how often their abundance is associated with the other in the network. (Figure from Kang et al. (Citation17) under an open access license of PLoS journals called the Creative Commons Attribution (CC-BY) license.)
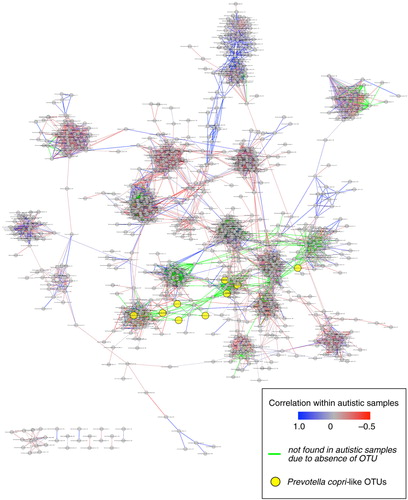
Fig. 3 The fecal microbiota of individuals with ASD in the U.S. shows a greater divergence from individuals in agrarian cultures compared to neurotypical controls. Unweighted UniFrac PCoA plot comparing data from children with ASD and neurotypical control in the U.S. (Citation21) with a global survey of fecal microbial community composition conducted in individuals from Malawi, the Amazonas State of Venezuela, and the U.S. (Citation35) (global gut). (a) Points colored by country of residence. (b) Same plot, but with points colored by study/ASD status.