Figures & data
Table 1 Bifidobacterial cell number in growth bullion submitted to simulated gastric or duodenum juice
Table 2 Average bacteria cell number of Bifidobacterium bifidum s1 in fermented milk submitted to simulated gastric or duodenum juices
Table 3 Average bacteria cell number of Bifidobacterium lactis Bo in fermented milk submitted to simulated gastric or duodenum juices
Table 4 Average bacteria cell number of Bifidobacterium animalis ssp. lactis Bb12 in fermented milk submitted to simulated gastric or duodenum juices
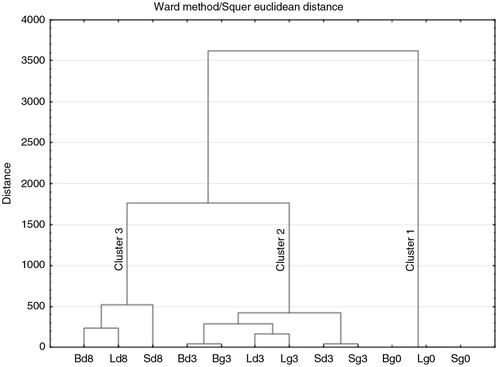
Fig. 1 Dendrogram representing the similarity relationships among the bifidobacteria survival rate in fermented milk sample during subsequent incubation under conditions of in vitro model digestive juices. B, L, S – the samples fermented by B. bifidum s1, B. lactis Bo, and B. animalis ssp. lactis Bb12, respectively; d, g – simulated duodenum and gastric juices, respectively; 8, 3, 0 – incubation time (hours) in model digestive juices.