
Figures & data
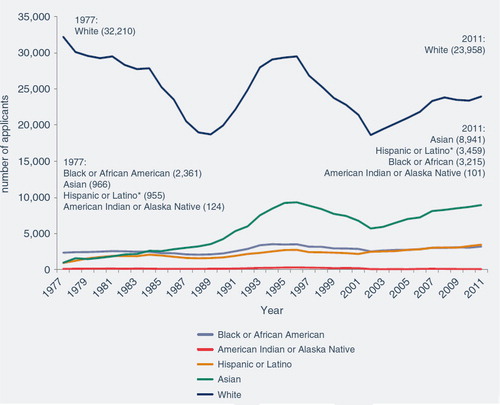
Note: 1) White, Asian, Black, and Native American, are Non-Hispanic. Since 2002, individuals have the option of reporting both their race and ethnicity alone or in combination with some other race or ethnicity. In this figure, numbers are reported for race alone; 2) The data is adapted from by Castillo (Citation2). *From 1974–2001, includes Mexican American, Puerto Rican, and Other Hispanic. Since 2002, includes Cuban, Mexican American, Puerto Rican, Other Hispanic, and Multiple Hispanic. Source: AAMC Data Warehouse: Applicant Matriculant File, as of 1/26/2012.
Note: 1) Those that reported more than one race are included under Non-Hispanic or more than One Latino Race; 2) The data is adapted from Castillo (Citation2).
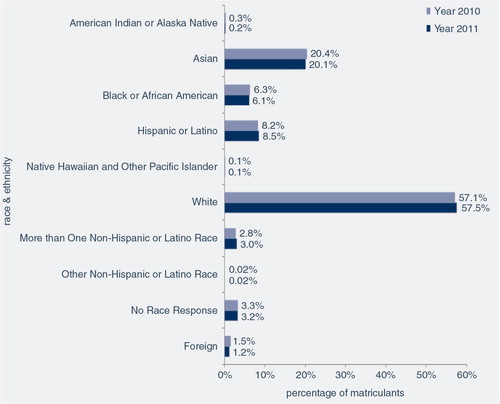
Table 2. Medical school reported barries to underrepresented minority recruitment
(D) Table 1. Underrepresented minority student matriculants at University of Toledo College of Medicine, 1996–2006
3 Cohorts average cognitive gains