Figures & data
Fig. 1. Diagram showing the inclusion and exclusion criteria of faculty evaluations.
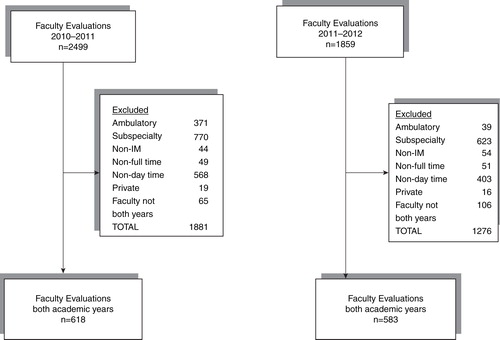
Table 1 Means (standard deviations) and significant pairwise comparisons from the ANOVA results for each competency score and total scores across the four evaluations (July–September, October–December, January–March, April–June) for PGY-1, PGY-2, and PGY-3 residents evaluated using the Dreyfus and Milestone models
Table 2 MANOVA results for each of the competency and total scores
Fig. 2. House staff evaluation scores done by full-time day faculty across the competencies patient care and medical knowledge and overall score across both evaluation models.
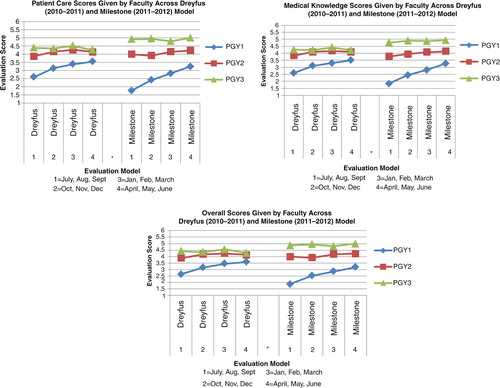
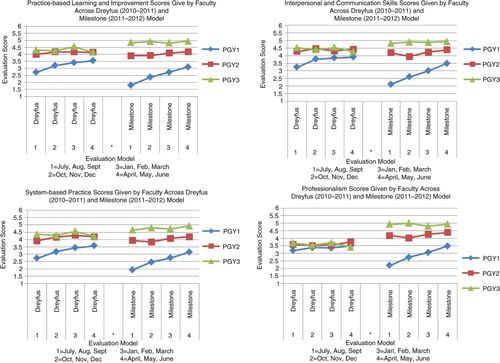
Fig. 3. House staff evaluation scores done by full-time day faculty across the competencies practice-based learning and improvement, interpersonal and communication skills, systems-based practice and professionalism across both evaluation models.