Figures & data
Fig. 1. Distribution of number of CR visits 21 days before an exam. The distribution was derived from approximately 20 exam periods each for 408 first-year medical students across four cohorts from 2006 to 2010.
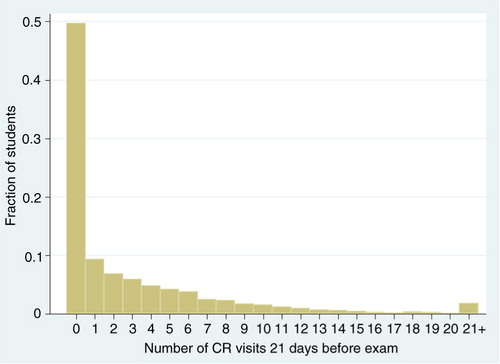
Table 1 Characteristics of first-year medical students (N=408)
Fig. 2. Average exam scores and CR visits by month of the academic year. Each point corresponds to the mean percentage exam score (in blue), and number of campus recreation (CR) visits (in red) for 408 first-year medical students for exams given in each month of the academic year. Number of CR visits was calculated as the number of times a student visited a CR facility in the 21-day period prior to an exam date.
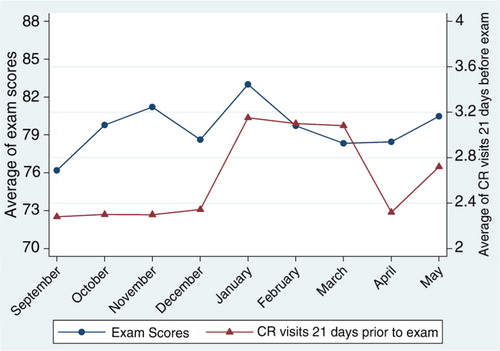
Fig. 3. Conditional means of CR visits and exam performance. An exam score of 60% represents the passing level for most exams. The data are based on approximately 20 exam sessions each for 408 first-year medical over 4 years. In (a), the number of CR visits is calculated as the number of times a student visited a CR facility in the 21-day period after an exam date. In (b), the number of CR visits is calculated as the number of times a student visited a CR facility in the 21-day period prior to an exam date.
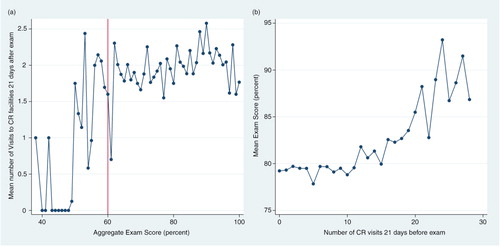
Table. 2. Results of Ordinary Least Squares (OLS) regression models estimating the reciprocal relationship between changes in academic performance and changes in CR use
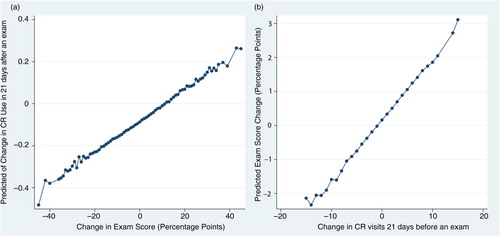
Fig. 4. Predicted changes in CR use and academic performance from regression models. Graph (a) plots the average predicted values of ΔCR visits from the regression shown in Column 1 of Table 2. Graph (b) plots the average predicted values of ΔExam Score from the regression shown in Column 2 of Table 2.