
Figures & data
Table 1 Examples of scholarly concentration educational components and final projects
Fig. 1. Participation in AMS’ elective SC Program. Data from the first five graduating classes to participate in the program were analyzed for percent of students choosing to participate in the program (a), attrition prior to graduation, defined as the percent of students who started the program who did not complete it (b), distribution of students among specific concentration areas (c), and completion rate for the various concentrations (d).
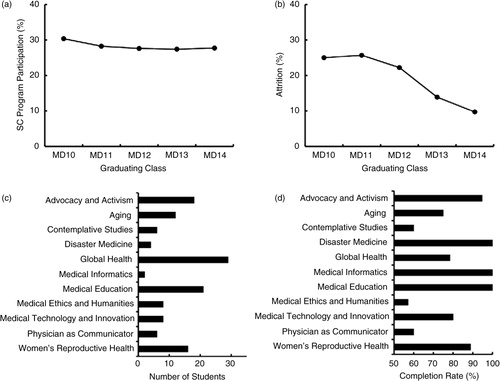
Fig. 2. Distribution of the number of publications per student. Data are shown for concentrators and non-concentrators.
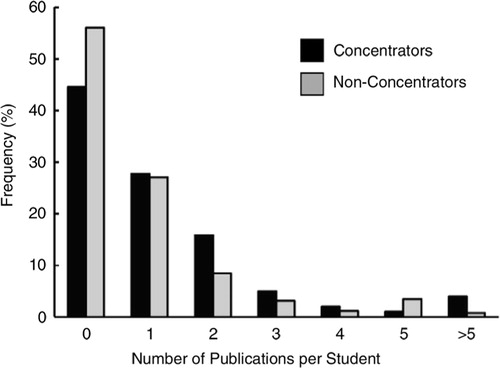
Table 2 Demographic data
Table 3 Academic performance dataa